Bacillus phage Wes44
Taxonomy: Viruses; Duplodnaviria; Heunggongvirae; Uroviricota; Caudoviricetes; Caudovirales; Siphoviridae; Gutmannvirinae; Carmenvirus; Bacillus virus Wes44
Average proteome isoelectric point is 6.17
Get precalculated fractions of proteins
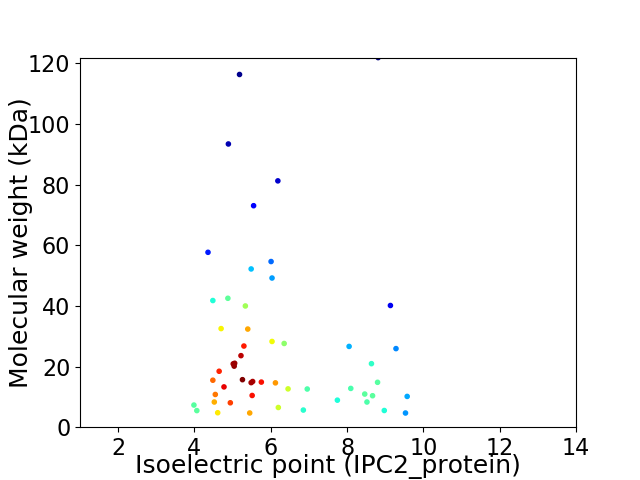
Virtual 2D-PAGE plot for 54 proteins (isoelectric point calculated using IPC2_protein)
Get csv file with sequences according to given criteria:
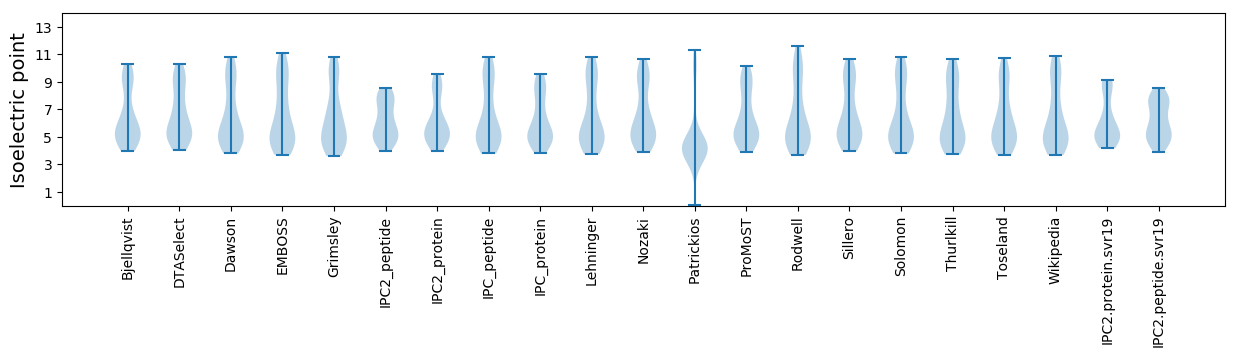
* You can choose from 21 different methods for calculating isoelectric point
Summary statistics related to proteome-wise predictions
Protein with the lowest isoelectric point:
>tr|A0A346FK31|A0A346FK31_9CAUD Thymidylate synthase OS=Bacillus phage Wes44 OX=2283012 GN=Wes44_27 PE=4 SV=1
MM1 pKa = 7.48KK2 pKa = 10.27KK3 pKa = 10.23VLLSSVLGLGVVSLVGCEE21 pKa = 3.68EE22 pKa = 3.91RR23 pKa = 11.84HH24 pKa = 6.39VYY26 pKa = 9.51FQGSLLPVSEE36 pKa = 4.22VEE38 pKa = 4.53EE39 pKa = 3.97RR40 pKa = 11.84LEE42 pKa = 6.25DD43 pKa = 4.52IIEE46 pKa = 4.37DD47 pKa = 3.72QNPDD51 pKa = 2.77FDD53 pKa = 5.02FEE55 pKa = 4.52VSIYY59 pKa = 10.89EE60 pKa = 4.1EE61 pKa = 4.56DD62 pKa = 3.73EE63 pKa = 4.11EE64 pKa = 4.62
MM1 pKa = 7.48KK2 pKa = 10.27KK3 pKa = 10.23VLLSSVLGLGVVSLVGCEE21 pKa = 3.68EE22 pKa = 3.91RR23 pKa = 11.84HH24 pKa = 6.39VYY26 pKa = 9.51FQGSLLPVSEE36 pKa = 4.22VEE38 pKa = 4.53EE39 pKa = 3.97RR40 pKa = 11.84LEE42 pKa = 6.25DD43 pKa = 4.52IIEE46 pKa = 4.37DD47 pKa = 3.72QNPDD51 pKa = 2.77FDD53 pKa = 5.02FEE55 pKa = 4.52VSIYY59 pKa = 10.89EE60 pKa = 4.1EE61 pKa = 4.56DD62 pKa = 3.73EE63 pKa = 4.11EE64 pKa = 4.62
Molecular weight: 7.3 kDa
Isoelectric point according different methods:
Protein with the highest isoelectric point:
>tr|A0A346FK21|A0A346FK21_9CAUD Uncharacterized protein OS=Bacillus phage Wes44 OX=2283012 GN=Wes44_17 PE=4 SV=1
MM1 pKa = 7.11LTHH4 pKa = 6.64GFSRR8 pKa = 11.84VAILNALLSYY18 pKa = 10.47GYY20 pKa = 11.06NSMVAKK26 pKa = 10.4LYY28 pKa = 10.08VEE30 pKa = 4.16RR31 pKa = 11.84FEE33 pKa = 4.93AKK35 pKa = 10.29NKK37 pKa = 10.15IKK39 pKa = 10.53ISS41 pKa = 3.48
MM1 pKa = 7.11LTHH4 pKa = 6.64GFSRR8 pKa = 11.84VAILNALLSYY18 pKa = 10.47GYY20 pKa = 11.06NSMVAKK26 pKa = 10.4LYY28 pKa = 10.08VEE30 pKa = 4.16RR31 pKa = 11.84FEE33 pKa = 4.93AKK35 pKa = 10.29NKK37 pKa = 10.15IKK39 pKa = 10.53ISS41 pKa = 3.48
Molecular weight: 4.68 kDa
Isoelectric point according different methods:
Peptides (in silico digests for buttom-up proteomics)
Below you can find in silico digests of the whole proteome with Trypsin, Chymotrypsin, Trypsin+LysC, LysN, ArgC proteases suitable for different mass spec machines.| Try ESI |
 |
|---|
| ChTry ESI |
|
|---|
| ArgC ESI |
|
|---|
| LysN ESI |
|
|---|
| TryLysC ESI |
|
|---|
| Try MALDI |
|
|---|
| ChTry MALDI |
|
|---|
| ArgC MALDI |
|
|---|
| LysN MALDI |
|
|---|
| TryLysC MALDI |
|
|---|
| Try LTQ |
|
|---|
| ChTry LTQ |
|
|---|
| ArgC LTQ |
|
|---|
| LysN LTQ |
|
|---|
| TryLysC LTQ |
|
|---|
| Try MSlow |
|
|---|
| ChTry MSlow |
|
|---|
| ArgC MSlow |
|
|---|
| LysN MSlow |
|
|---|
| TryLysC MSlow |
|
|---|
| Try MShigh |
|
|---|
| ChTry MShigh |
|
|---|
| ArgC MShigh |
|
|---|
| LysN MShigh |
|
|---|
| TryLysC MShigh |
|
|---|
General Statistics
Number of major isoforms |
Number of additional isoforms |
Number of all proteins |
Number of amino acids |
Min. Seq. Length |
Max. Seq. Length |
Avg. Seq. Length |
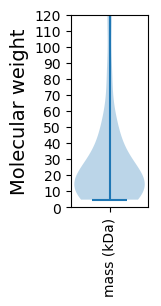
Avg. Mol. Weight |
|---|---|---|---|---|---|---|---|
0 |
13159 |
40 |
1120 |
243.7 |
27.34 |
Amino acid frequency
Ala |
Cys |
Asp |
Glu |
Phe |
Gly |
His |
Ile |
Lys |
Leu |
|---|---|---|---|---|---|---|---|---|---|
8.405 ± 0.546 | 0.828 ± 0.147 |
6.368 ± 0.398 | 7.242 ± 0.561 |
3.739 ± 0.148 | 6.566 ± 0.289 |
1.695 ± 0.196 | 6.513 ± 0.227 |
7.584 ± 0.433 | 7.599 ± 0.316 |
Met |
Asn |
Gln |
Pro |
Arg |
Ser |
Thr |
Val |
Trp |
Tyr |
|---|---|---|---|---|---|---|---|---|---|
3.207 ± 0.257 | 5.168 ± 0.31 |
3.594 ± 0.235 | 3.488 ± 0.192 |
4.202 ± 0.235 | 5.548 ± 0.408 |
6.216 ± 0.423 | 6.839 ± 0.333 |
1.444 ± 0.173 | 3.754 ± 0.216 |
Most of the basic statistics you can see at this page can be downloaded from this CSV file
See this proteome in:

Proteome-pI is available under Creative Commons Attribution-NoDerivs license, for more details see here
| Reference: Kozlowski LP. Proteome-pI 2.0: Proteome Isoelectric Point Database Update. Nucleic Acids Res. 2021, doi: 10.1093/nar/gkab944 | Contact: Lukasz P. Kozlowski |