Prosthecochloris sp. CIB 2401
Taxonomy: cellular organisms; Bacteria; FCB group; Bacteroidetes/Chlorobi group; Chlorobi; Chlorobia; Chlorobiales; Chlorobiaceae; Prosthecochloris; unclassified Prosthecochloris
Average proteome isoelectric point is 6.28
Get precalculated fractions of proteins
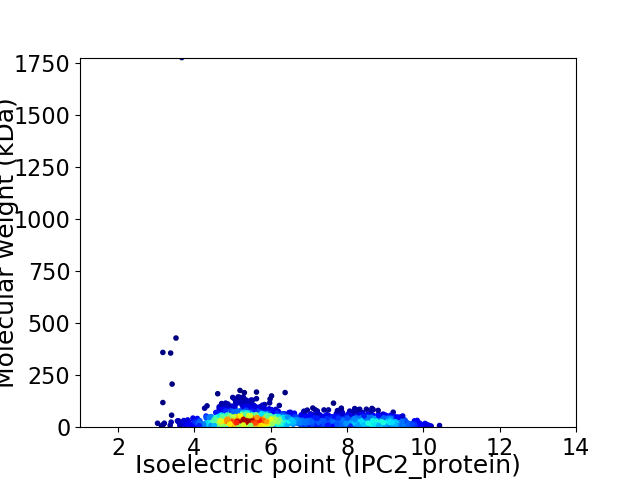
Virtual 2D-PAGE plot for 2188 proteins (isoelectric point calculated using IPC2_protein)
Get csv file with sequences according to given criteria:
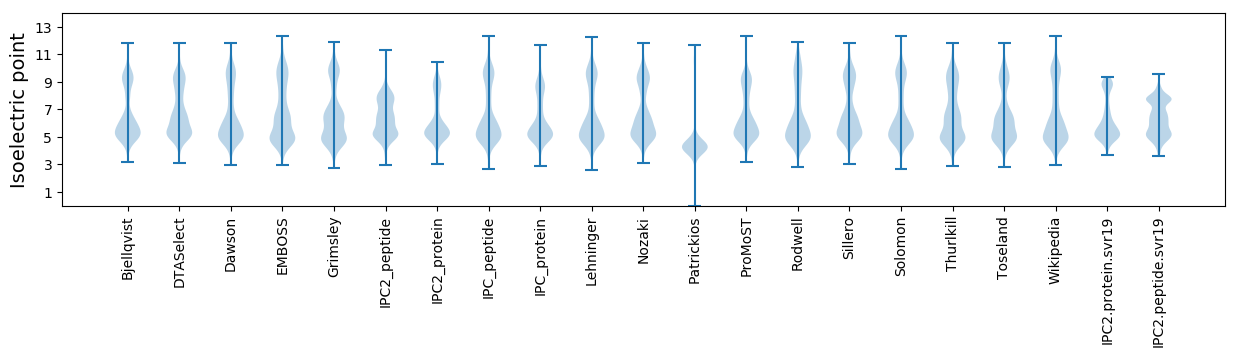
* You can choose from 21 different methods for calculating isoelectric point
Summary statistics related to proteome-wise predictions
Protein with the lowest isoelectric point:
>tr|A0A1B1Q2C6|A0A1B1Q2C6_9CHLB Putative FAD-binding dehydrogenase OS=Prosthecochloris sp. CIB 2401 OX=1868325 GN=Ptc2401_01238 PE=4 SV=1
MM1 pKa = 7.43KK2 pKa = 10.05KK3 pKa = 9.48IHH5 pKa = 6.96DD6 pKa = 3.87TTTANNWLQRR16 pKa = 11.84CAKK19 pKa = 9.21TALLVFGVLMPIAGPLTAHH38 pKa = 6.34AVEE41 pKa = 4.97SSVQSTARR49 pKa = 11.84PFGLDD54 pKa = 2.58IVAPVYY60 pKa = 10.2EE61 pKa = 4.82AGSDD65 pKa = 3.48EE66 pKa = 4.53AAVTFQTEE74 pKa = 4.14YY75 pKa = 11.31LPTLNDD81 pKa = 4.33WIDD84 pKa = 3.38QTLGEE89 pKa = 4.74TVSLDD94 pKa = 3.74NISSYY99 pKa = 11.64SLDD102 pKa = 3.64PSQLTLTTASDD113 pKa = 3.32VRR115 pKa = 11.84VYY117 pKa = 10.21FIGEE121 pKa = 3.75GAGYY125 pKa = 10.68KK126 pKa = 8.77NTLGFYY132 pKa = 10.29TDD134 pKa = 3.76GSDD137 pKa = 5.92DD138 pKa = 3.49ITTGDD143 pKa = 3.55AQLIFPNLTSNVSYY157 pKa = 10.87MNATDD162 pKa = 5.08LSNASANINFPLVPGDD178 pKa = 4.15FVDD181 pKa = 5.3LGTMDD186 pKa = 5.09AGTEE190 pKa = 3.84LDD192 pKa = 4.24FFLIADD198 pKa = 4.62GASGGTNVYY207 pKa = 9.09STDD210 pKa = 3.16ASLNPDD216 pKa = 4.17GIDD219 pKa = 3.15HH220 pKa = 5.53VVAYY224 pKa = 9.96AVEE227 pKa = 4.34DD228 pKa = 3.59SPYY231 pKa = 10.84LLVGFEE237 pKa = 4.66DD238 pKa = 4.37LFGGGDD244 pKa = 3.27QDD246 pKa = 4.29YY247 pKa = 11.08NDD249 pKa = 3.72VLFAIDD255 pKa = 3.5IGSINVDD262 pKa = 3.31ALTTASEE269 pKa = 4.23PSTVLLLGSFLLLAIYY285 pKa = 9.76LKK287 pKa = 10.68NRR289 pKa = 11.84QQHH292 pKa = 5.74LAAEE296 pKa = 4.35RR297 pKa = 11.84QNAA300 pKa = 3.28
MM1 pKa = 7.43KK2 pKa = 10.05KK3 pKa = 9.48IHH5 pKa = 6.96DD6 pKa = 3.87TTTANNWLQRR16 pKa = 11.84CAKK19 pKa = 9.21TALLVFGVLMPIAGPLTAHH38 pKa = 6.34AVEE41 pKa = 4.97SSVQSTARR49 pKa = 11.84PFGLDD54 pKa = 2.58IVAPVYY60 pKa = 10.2EE61 pKa = 4.82AGSDD65 pKa = 3.48EE66 pKa = 4.53AAVTFQTEE74 pKa = 4.14YY75 pKa = 11.31LPTLNDD81 pKa = 4.33WIDD84 pKa = 3.38QTLGEE89 pKa = 4.74TVSLDD94 pKa = 3.74NISSYY99 pKa = 11.64SLDD102 pKa = 3.64PSQLTLTTASDD113 pKa = 3.32VRR115 pKa = 11.84VYY117 pKa = 10.21FIGEE121 pKa = 3.75GAGYY125 pKa = 10.68KK126 pKa = 8.77NTLGFYY132 pKa = 10.29TDD134 pKa = 3.76GSDD137 pKa = 5.92DD138 pKa = 3.49ITTGDD143 pKa = 3.55AQLIFPNLTSNVSYY157 pKa = 10.87MNATDD162 pKa = 5.08LSNASANINFPLVPGDD178 pKa = 4.15FVDD181 pKa = 5.3LGTMDD186 pKa = 5.09AGTEE190 pKa = 3.84LDD192 pKa = 4.24FFLIADD198 pKa = 4.62GASGGTNVYY207 pKa = 9.09STDD210 pKa = 3.16ASLNPDD216 pKa = 4.17GIDD219 pKa = 3.15HH220 pKa = 5.53VVAYY224 pKa = 9.96AVEE227 pKa = 4.34DD228 pKa = 3.59SPYY231 pKa = 10.84LLVGFEE237 pKa = 4.66DD238 pKa = 4.37LFGGGDD244 pKa = 3.27QDD246 pKa = 4.29YY247 pKa = 11.08NDD249 pKa = 3.72VLFAIDD255 pKa = 3.5IGSINVDD262 pKa = 3.31ALTTASEE269 pKa = 4.23PSTVLLLGSFLLLAIYY285 pKa = 9.76LKK287 pKa = 10.68NRR289 pKa = 11.84QQHH292 pKa = 5.74LAAEE296 pKa = 4.35RR297 pKa = 11.84QNAA300 pKa = 3.28
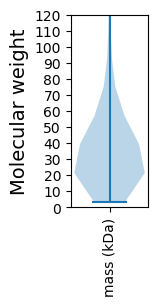
Molecular weight: 32.01 kDa
Isoelectric point according different methods:
Protein with the highest isoelectric point:
>tr|A0A1B1Q200|A0A1B1Q200_9CHLB Stalked cell differentiation-controlling protein OS=Prosthecochloris sp. CIB 2401 OX=1868325 GN=pleD PE=4 SV=1
MM1 pKa = 7.37EE2 pKa = 4.21HH3 pKa = 6.37TNRR6 pKa = 11.84EE7 pKa = 4.08KK8 pKa = 10.73AIHH11 pKa = 6.44AFMSGRR17 pKa = 11.84INGRR21 pKa = 11.84VYY23 pKa = 10.99SRR25 pKa = 11.84AARR28 pKa = 11.84IFRR31 pKa = 11.84AGSFHH36 pKa = 7.43FMLAMLALCSVSLFTLGEE54 pKa = 4.03HH55 pKa = 5.96KK56 pKa = 10.48YY57 pKa = 10.69EE58 pKa = 4.9RR59 pKa = 11.84IRR61 pKa = 11.84APRR64 pKa = 11.84FKK66 pKa = 10.47YY67 pKa = 10.33GRR69 pKa = 11.84STHH72 pKa = 6.93DD73 pKa = 4.62PIHH76 pKa = 6.51ACVEE80 pKa = 4.28VMSQLL85 pKa = 3.49
MM1 pKa = 7.37EE2 pKa = 4.21HH3 pKa = 6.37TNRR6 pKa = 11.84EE7 pKa = 4.08KK8 pKa = 10.73AIHH11 pKa = 6.44AFMSGRR17 pKa = 11.84INGRR21 pKa = 11.84VYY23 pKa = 10.99SRR25 pKa = 11.84AARR28 pKa = 11.84IFRR31 pKa = 11.84AGSFHH36 pKa = 7.43FMLAMLALCSVSLFTLGEE54 pKa = 4.03HH55 pKa = 5.96KK56 pKa = 10.48YY57 pKa = 10.69EE58 pKa = 4.9RR59 pKa = 11.84IRR61 pKa = 11.84APRR64 pKa = 11.84FKK66 pKa = 10.47YY67 pKa = 10.33GRR69 pKa = 11.84STHH72 pKa = 6.93DD73 pKa = 4.62PIHH76 pKa = 6.51ACVEE80 pKa = 4.28VMSQLL85 pKa = 3.49
Molecular weight: 9.81 kDa
Isoelectric point according different methods:
Peptides (in silico digests for buttom-up proteomics)
Below you can find in silico digests of the whole proteome with Trypsin, Chymotrypsin, Trypsin+LysC, LysN, ArgC proteases suitable for different mass spec machines.| Try ESI |
 |
|---|
| ChTry ESI |
|
|---|
| ArgC ESI |
|
|---|
| LysN ESI |
|
|---|
| TryLysC ESI |
|
|---|
| Try MALDI |
|
|---|
| ChTry MALDI |
|
|---|
| ArgC MALDI |
|
|---|
| LysN MALDI |
|
|---|
| TryLysC MALDI |
|
|---|
| Try LTQ |
|
|---|
| ChTry LTQ |
|
|---|
| ArgC LTQ |
|
|---|
| LysN LTQ |
|
|---|
| TryLysC LTQ |
|
|---|
| Try MSlow |
|
|---|
| ChTry MSlow |
|
|---|
| ArgC MSlow |
|
|---|
| LysN MSlow |
|
|---|
| TryLysC MSlow |
|
|---|
| Try MShigh |
|
|---|
| ChTry MShigh |
|
|---|
| ArgC MShigh |
|
|---|
| LysN MShigh |
|
|---|
| TryLysC MShigh |
|
|---|
General Statistics
Number of major isoforms |
Number of additional isoforms |
Number of all proteins |
Number of amino acids |
Min. Seq. Length |
Max. Seq. Length |
Avg. Seq. Length |
Avg. Mol. Weight |
|---|---|---|---|---|---|---|---|
0 |
727722 |
30 |
17345 |
332.6 |
36.85 |
Amino acid frequency
Ala |
Cys |
Asp |
Glu |
Phe |
Gly |
His |
Ile |
Lys |
Leu |
|---|---|---|---|---|---|---|---|---|---|
8.788 ± 0.081 | 1.028 ± 0.035 |
5.569 ± 0.092 | 7.049 ± 0.057 |
4.156 ± 0.042 | 7.785 ± 0.122 |
2.18 ± 0.049 | 6.206 ± 0.043 |
4.619 ± 0.098 | 10.248 ± 0.067 |
Met |
Asn |
Gln |
Pro |
Arg |
Ser |
Thr |
Val |
Trp |
Tyr |
|---|---|---|---|---|---|---|---|---|---|
2.692 ± 0.038 | 3.329 ± 0.034 |
4.202 ± 0.074 | 3.416 ± 0.034 |
5.94 ± 0.104 | 6.364 ± 0.093 |
5.293 ± 0.1 | 7.098 ± 0.064 |
1.06 ± 0.025 | 2.978 ± 0.036 |
Most of the basic statistics you can see at this page can be downloaded from this CSV file
See this proteome in:

Proteome-pI is available under Creative Commons Attribution-NoDerivs license, for more details see here
| Reference: Kozlowski LP. Proteome-pI 2.0: Proteome Isoelectric Point Database Update. Nucleic Acids Res. 2021, doi: 10.1093/nar/gkab944 | Contact: Lukasz P. Kozlowski |