Herbinix hemicellulosilytica
Taxonomy: cellular organisms; Bacteria; Terrabacteria group; Firmicutes; Clostridia; Eubacteriales; Lachnospiraceae; Herbinix
Average proteome isoelectric point is 6.35
Get precalculated fractions of proteins
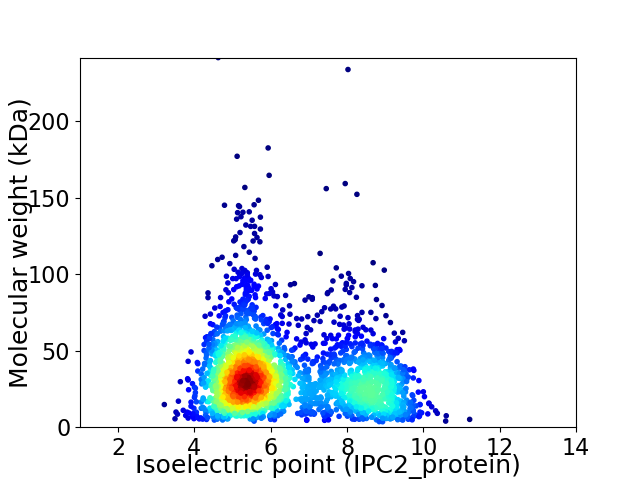
Virtual 2D-PAGE plot for 2640 proteins (isoelectric point calculated using IPC2_protein)
Get csv file with sequences according to given criteria:
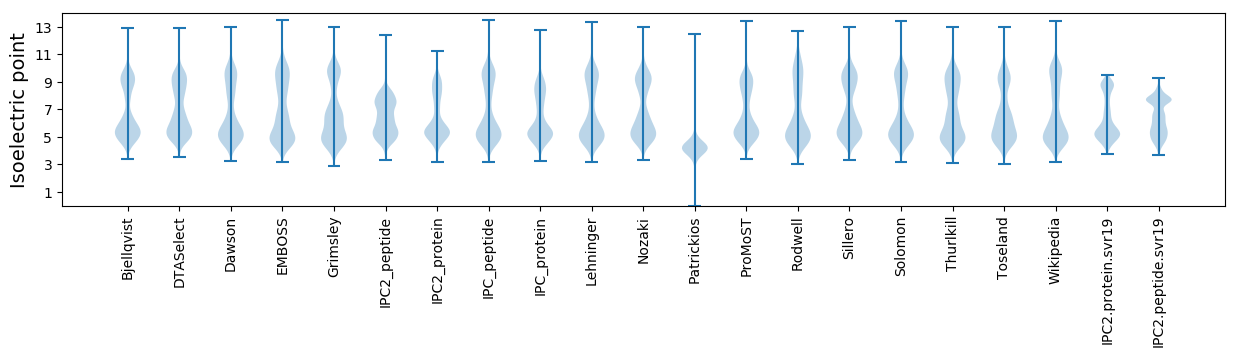
* You can choose from 21 different methods for calculating isoelectric point
Summary statistics related to proteome-wise predictions
Protein with the lowest isoelectric point:
>tr|A0A0H5SGV9|A0A0H5SGV9_HERHM Rubrerythrin domain-containing protein OS=Herbinix hemicellulosilytica OX=1564487 GN=HHT355_1503 PE=4 SV=1
MM1 pKa = 7.94RR2 pKa = 11.84KK3 pKa = 9.58FEE5 pKa = 4.39CTACGYY11 pKa = 10.27IYY13 pKa = 10.36DD14 pKa = 4.79EE15 pKa = 4.71EE16 pKa = 6.36LGDD19 pKa = 4.47PDD21 pKa = 4.98NGIAPGTKK29 pKa = 8.95WEE31 pKa = 4.91DD32 pKa = 3.84LPDD35 pKa = 3.86DD36 pKa = 4.55WVCPLCGVGKK46 pKa = 10.43EE47 pKa = 4.11DD48 pKa = 4.81FEE50 pKa = 4.98EE51 pKa = 4.72ISS53 pKa = 3.29
MM1 pKa = 7.94RR2 pKa = 11.84KK3 pKa = 9.58FEE5 pKa = 4.39CTACGYY11 pKa = 10.27IYY13 pKa = 10.36DD14 pKa = 4.79EE15 pKa = 4.71EE16 pKa = 6.36LGDD19 pKa = 4.47PDD21 pKa = 4.98NGIAPGTKK29 pKa = 8.95WEE31 pKa = 4.91DD32 pKa = 3.84LPDD35 pKa = 3.86DD36 pKa = 4.55WVCPLCGVGKK46 pKa = 10.43EE47 pKa = 4.11DD48 pKa = 4.81FEE50 pKa = 4.98EE51 pKa = 4.72ISS53 pKa = 3.29
Molecular weight: 5.96 kDa
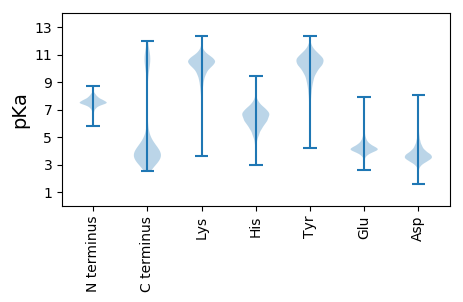
Isoelectric point according different methods:
Protein with the highest isoelectric point:
>tr|A0A0H5SJR3|A0A0H5SJR3_HERHM Histidine kinase OS=Herbinix hemicellulosilytica OX=1564487 GN=HHT355_1801 PE=4 SV=1
MM1 pKa = 7.45KK2 pKa = 9.59RR3 pKa = 11.84TFQPSKK9 pKa = 9.56KK10 pKa = 9.34PRR12 pKa = 11.84ARR14 pKa = 11.84VHH16 pKa = 6.08GFRR19 pKa = 11.84ARR21 pKa = 11.84MRR23 pKa = 11.84TKK25 pKa = 10.3GGRR28 pKa = 11.84KK29 pKa = 8.8VLSARR34 pKa = 11.84RR35 pKa = 11.84AKK37 pKa = 10.12GRR39 pKa = 11.84KK40 pKa = 9.08KK41 pKa = 9.67LTAA44 pKa = 4.2
MM1 pKa = 7.45KK2 pKa = 9.59RR3 pKa = 11.84TFQPSKK9 pKa = 9.56KK10 pKa = 9.34PRR12 pKa = 11.84ARR14 pKa = 11.84VHH16 pKa = 6.08GFRR19 pKa = 11.84ARR21 pKa = 11.84MRR23 pKa = 11.84TKK25 pKa = 10.3GGRR28 pKa = 11.84KK29 pKa = 8.8VLSARR34 pKa = 11.84RR35 pKa = 11.84AKK37 pKa = 10.12GRR39 pKa = 11.84KK40 pKa = 9.08KK41 pKa = 9.67LTAA44 pKa = 4.2
Molecular weight: 5.11 kDa
Isoelectric point according different methods:
Peptides (in silico digests for buttom-up proteomics)
Below you can find in silico digests of the whole proteome with Trypsin, Chymotrypsin, Trypsin+LysC, LysN, ArgC proteases suitable for different mass spec machines.| Try ESI |
 |
|---|
| ChTry ESI |
|
|---|
| ArgC ESI |
|
|---|
| LysN ESI |
|
|---|
| TryLysC ESI |
|
|---|
| Try MALDI |
|
|---|
| ChTry MALDI |
|
|---|
| ArgC MALDI |
|
|---|
| LysN MALDI |
|
|---|
| TryLysC MALDI |
|
|---|
| Try LTQ |
|
|---|
| ChTry LTQ |
|
|---|
| ArgC LTQ |
|
|---|
| LysN LTQ |
|
|---|
| TryLysC LTQ |
|
|---|
| Try MSlow |
|
|---|
| ChTry MSlow |
|
|---|
| ArgC MSlow |
|
|---|
| LysN MSlow |
|
|---|
| TryLysC MSlow |
|
|---|
| Try MShigh |
|
|---|
| ChTry MShigh |
|
|---|
| ArgC MShigh |
|
|---|
| LysN MShigh |
|
|---|
| TryLysC MShigh |
|
|---|
General Statistics
Number of major isoforms |
Number of additional isoforms |
Number of all proteins |
Number of amino acids |
Min. Seq. Length |
Max. Seq. Length |
Avg. Seq. Length |
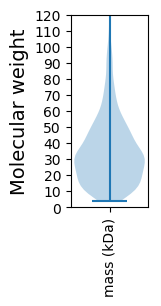
Avg. Mol. Weight |
|---|---|---|---|---|---|---|---|
0 |
848450 |
30 |
2152 |
321.4 |
36.37 |
Amino acid frequency
Ala |
Cys |
Asp |
Glu |
Phe |
Gly |
His |
Ile |
Lys |
Leu |
|---|---|---|---|---|---|---|---|---|---|
6.41 ± 0.046 | 1.184 ± 0.02 |
5.872 ± 0.036 | 7.263 ± 0.053 |
4.255 ± 0.035 | 6.382 ± 0.044 |
1.518 ± 0.019 | 9.14 ± 0.047 |
8.02 ± 0.041 | 9.135 ± 0.049 |
Met |
Asn |
Gln |
Pro |
Arg |
Ser |
Thr |
Val |
Trp |
Tyr |
|---|---|---|---|---|---|---|---|---|---|
2.656 ± 0.02 | 5.486 ± 0.037 |
3.229 ± 0.029 | 2.631 ± 0.022 |
4.095 ± 0.036 | 5.767 ± 0.032 |
5.124 ± 0.036 | 6.396 ± 0.04 |
0.797 ± 0.016 | 4.64 ± 0.038 |
Most of the basic statistics you can see at this page can be downloaded from this CSV file
See this proteome in:

Proteome-pI is available under Creative Commons Attribution-NoDerivs license, for more details see here
| Reference: Kozlowski LP. Proteome-pI 2.0: Proteome Isoelectric Point Database Update. Nucleic Acids Res. 2021, doi: 10.1093/nar/gkab944 | Contact: Lukasz P. Kozlowski |