Phytohabitans flavus
Taxonomy: cellular organisms; Bacteria; Terrabacteria group; Actinobacteria; Actinomycetia; Micromonosporales; Micromonosporaceae; Phytohabitans
Average proteome isoelectric point is 6.56
Get precalculated fractions of proteins
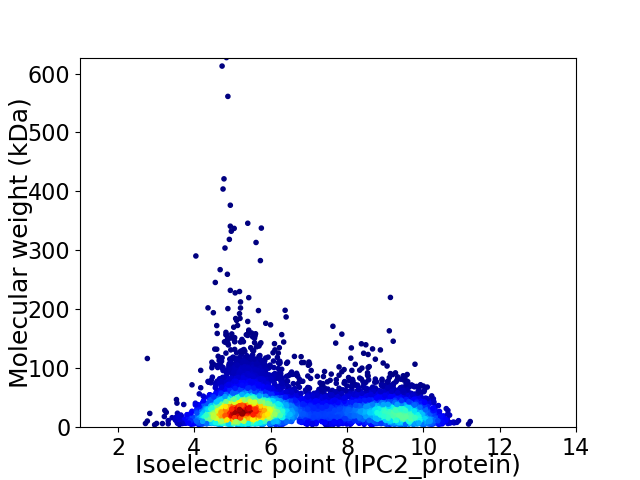
Virtual 2D-PAGE plot for 9064 proteins (isoelectric point calculated using IPC2_protein)
Get csv file with sequences according to given criteria:
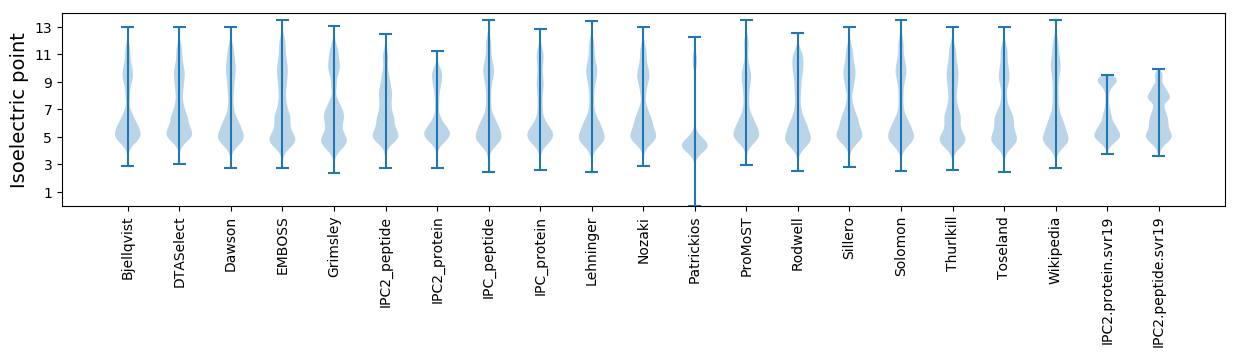
* You can choose from 21 different methods for calculating isoelectric point
Summary statistics related to proteome-wise predictions
Protein with the lowest isoelectric point:
>tr|A0A6F8Y4D7|A0A6F8Y4D7_9ACTN Uncharacterized protein OS=Phytohabitans flavus OX=1076124 GN=Pflav_073030 PE=4 SV=1
MM1 pKa = 7.86SEE3 pKa = 4.59FDD5 pKa = 5.56DD6 pKa = 4.04PTLTEE11 pKa = 4.7DD12 pKa = 3.99PGTGHH17 pKa = 6.87EE18 pKa = 4.58GFGNAGDD25 pKa = 4.5SGHH28 pKa = 6.94DD29 pKa = 3.35QPGYY33 pKa = 10.04DD34 pKa = 4.83QPGHH38 pKa = 6.13DD39 pKa = 4.14QPPYY43 pKa = 10.85GHH45 pKa = 7.13DD46 pKa = 3.18QPHH49 pKa = 6.28YY50 pKa = 9.4EE51 pKa = 4.26EE52 pKa = 4.32PHH54 pKa = 5.77YY55 pKa = 10.18GQPDD59 pKa = 4.03SIVQHH64 pKa = 6.27NPDD67 pKa = 3.57GSTDD71 pKa = 3.55TVVDD75 pKa = 4.59LDD77 pKa = 3.78GDD79 pKa = 4.24GYY81 pKa = 11.67ADD83 pKa = 3.76VVKK86 pKa = 10.62HH87 pKa = 5.92DD88 pKa = 4.27TDD90 pKa = 3.75SDD92 pKa = 4.37GYY94 pKa = 11.73ADD96 pKa = 3.78TTYY99 pKa = 11.25VDD101 pKa = 3.84ANHH104 pKa = 7.41DD105 pKa = 3.71GRR107 pKa = 11.84LDD109 pKa = 4.11TILKK113 pKa = 10.57DD114 pKa = 3.71YY115 pKa = 11.36DD116 pKa = 4.09DD117 pKa = 6.47DD118 pKa = 6.58GDD120 pKa = 4.29LDD122 pKa = 4.31AAFADD127 pKa = 4.28TNADD131 pKa = 3.06GRR133 pKa = 11.84VDD135 pKa = 3.53YY136 pKa = 10.95AAADD140 pKa = 3.96LNDD143 pKa = 4.31DD144 pKa = 3.87NKK146 pKa = 10.36VDD148 pKa = 4.43HH149 pKa = 6.38VTLDD153 pKa = 3.05TDD155 pKa = 4.03YY156 pKa = 11.57DD157 pKa = 4.02GKK159 pKa = 11.07ADD161 pKa = 3.43TWIADD166 pKa = 3.24VDD168 pKa = 4.09YY169 pKa = 11.27DD170 pKa = 4.04GQPDD174 pKa = 3.77VAFVDD179 pKa = 4.31TNHH182 pKa = 7.44DD183 pKa = 3.64GTPDD187 pKa = 3.5VAVSDD192 pKa = 4.51ANHH195 pKa = 7.31DD196 pKa = 3.88GTPEE200 pKa = 3.89QQTAAPQTVTPPPPVNPYY218 pKa = 9.87AASS221 pKa = 3.26
MM1 pKa = 7.86SEE3 pKa = 4.59FDD5 pKa = 5.56DD6 pKa = 4.04PTLTEE11 pKa = 4.7DD12 pKa = 3.99PGTGHH17 pKa = 6.87EE18 pKa = 4.58GFGNAGDD25 pKa = 4.5SGHH28 pKa = 6.94DD29 pKa = 3.35QPGYY33 pKa = 10.04DD34 pKa = 4.83QPGHH38 pKa = 6.13DD39 pKa = 4.14QPPYY43 pKa = 10.85GHH45 pKa = 7.13DD46 pKa = 3.18QPHH49 pKa = 6.28YY50 pKa = 9.4EE51 pKa = 4.26EE52 pKa = 4.32PHH54 pKa = 5.77YY55 pKa = 10.18GQPDD59 pKa = 4.03SIVQHH64 pKa = 6.27NPDD67 pKa = 3.57GSTDD71 pKa = 3.55TVVDD75 pKa = 4.59LDD77 pKa = 3.78GDD79 pKa = 4.24GYY81 pKa = 11.67ADD83 pKa = 3.76VVKK86 pKa = 10.62HH87 pKa = 5.92DD88 pKa = 4.27TDD90 pKa = 3.75SDD92 pKa = 4.37GYY94 pKa = 11.73ADD96 pKa = 3.78TTYY99 pKa = 11.25VDD101 pKa = 3.84ANHH104 pKa = 7.41DD105 pKa = 3.71GRR107 pKa = 11.84LDD109 pKa = 4.11TILKK113 pKa = 10.57DD114 pKa = 3.71YY115 pKa = 11.36DD116 pKa = 4.09DD117 pKa = 6.47DD118 pKa = 6.58GDD120 pKa = 4.29LDD122 pKa = 4.31AAFADD127 pKa = 4.28TNADD131 pKa = 3.06GRR133 pKa = 11.84VDD135 pKa = 3.53YY136 pKa = 10.95AAADD140 pKa = 3.96LNDD143 pKa = 4.31DD144 pKa = 3.87NKK146 pKa = 10.36VDD148 pKa = 4.43HH149 pKa = 6.38VTLDD153 pKa = 3.05TDD155 pKa = 4.03YY156 pKa = 11.57DD157 pKa = 4.02GKK159 pKa = 11.07ADD161 pKa = 3.43TWIADD166 pKa = 3.24VDD168 pKa = 4.09YY169 pKa = 11.27DD170 pKa = 4.04GQPDD174 pKa = 3.77VAFVDD179 pKa = 4.31TNHH182 pKa = 7.44DD183 pKa = 3.64GTPDD187 pKa = 3.5VAVSDD192 pKa = 4.51ANHH195 pKa = 7.31DD196 pKa = 3.88GTPEE200 pKa = 3.89QQTAAPQTVTPPPPVNPYY218 pKa = 9.87AASS221 pKa = 3.26
Molecular weight: 23.67 kDa
Isoelectric point according different methods:
Protein with the highest isoelectric point:
>tr|A0A6F8Y4C5|A0A6F8Y4C5_9ACTN Uncharacterized protein OS=Phytohabitans flavus OX=1076124 GN=Pflav_073760 PE=4 SV=1
MM1 pKa = 7.69PAAQPRR7 pKa = 11.84LPVAHH12 pKa = 7.25LAGPSLLAARR22 pKa = 11.84MPVVRR27 pKa = 11.84VRR29 pKa = 11.84LLVAHH34 pKa = 7.09LAGLSLPVPRR44 pKa = 11.84TPVARR49 pKa = 11.84VRR51 pKa = 11.84LSVVHH56 pKa = 6.54LVGLSLLAARR66 pKa = 11.84MPAARR71 pKa = 11.84VRR73 pKa = 11.84LLAVPLSGAWLARR86 pKa = 11.84VVAPAVV92 pKa = 3.25
MM1 pKa = 7.69PAAQPRR7 pKa = 11.84LPVAHH12 pKa = 7.25LAGPSLLAARR22 pKa = 11.84MPVVRR27 pKa = 11.84VRR29 pKa = 11.84LLVAHH34 pKa = 7.09LAGLSLPVPRR44 pKa = 11.84TPVARR49 pKa = 11.84VRR51 pKa = 11.84LSVVHH56 pKa = 6.54LVGLSLLAARR66 pKa = 11.84MPAARR71 pKa = 11.84VRR73 pKa = 11.84LLAVPLSGAWLARR86 pKa = 11.84VVAPAVV92 pKa = 3.25
Molecular weight: 9.59 kDa
Isoelectric point according different methods:
Peptides (in silico digests for buttom-up proteomics)
Below you can find in silico digests of the whole proteome with Trypsin, Chymotrypsin, Trypsin+LysC, LysN, ArgC proteases suitable for different mass spec machines.| Try ESI |
 |
|---|
| ChTry ESI |
|
|---|
| ArgC ESI |
|
|---|
| LysN ESI |
|
|---|
| TryLysC ESI |
|
|---|
| Try MALDI |
|
|---|
| ChTry MALDI |
|
|---|
| ArgC MALDI |
|
|---|
| LysN MALDI |
|
|---|
| TryLysC MALDI |
|
|---|
| Try LTQ |
|
|---|
| ChTry LTQ |
|
|---|
| ArgC LTQ |
|
|---|
| LysN LTQ |
|
|---|
| TryLysC LTQ |
|
|---|
| Try MSlow |
|
|---|
| ChTry MSlow |
|
|---|
| ArgC MSlow |
|
|---|
| LysN MSlow |
|
|---|
| TryLysC MSlow |
|
|---|
| Try MShigh |
|
|---|
| ChTry MShigh |
|
|---|
| ArgC MShigh |
|
|---|
| LysN MShigh |
|
|---|
| TryLysC MShigh |
|
|---|
General Statistics
Number of major isoforms |
Number of additional isoforms |
Number of all proteins |
Number of amino acids |
Min. Seq. Length |
Max. Seq. Length |
Avg. Seq. Length |
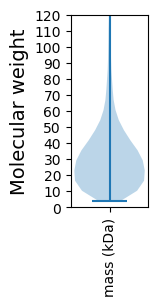
Avg. Mol. Weight |
|---|---|---|---|---|---|---|---|
0 |
2839989 |
39 |
6022 |
313.3 |
33.51 |
Amino acid frequency
Ala |
Cys |
Asp |
Glu |
Phe |
Gly |
His |
Ile |
Lys |
Leu |
|---|---|---|---|---|---|---|---|---|---|
13.947 ± 0.041 | 0.773 ± 0.008 |
5.951 ± 0.021 | 5.155 ± 0.022 |
2.756 ± 0.016 | 9.281 ± 0.025 |
2.09 ± 0.012 | 3.388 ± 0.018 |
1.738 ± 0.016 | 10.19 ± 0.031 |
Met |
Asn |
Gln |
Pro |
Arg |
Ser |
Thr |
Val |
Trp |
Tyr |
|---|---|---|---|---|---|---|---|---|---|
1.727 ± 0.01 | 1.872 ± 0.018 |
6.268 ± 0.021 | 2.779 ± 0.014 |
8.257 ± 0.032 | 5.113 ± 0.023 |
6.096 ± 0.025 | 8.84 ± 0.024 |
1.64 ± 0.012 | 2.139 ± 0.014 |
Most of the basic statistics you can see at this page can be downloaded from this CSV file
See this proteome in:

Proteome-pI is available under Creative Commons Attribution-NoDerivs license, for more details see here
| Reference: Kozlowski LP. Proteome-pI 2.0: Proteome Isoelectric Point Database Update. Nucleic Acids Res. 2021, doi: 10.1093/nar/gkab944 | Contact: Lukasz P. Kozlowski |