Nonomuraea phyllanthi
Taxonomy: cellular organisms; Bacteria; Terrabacteria group; Actinobacteria; Actinomycetia; Streptosporangiales; Streptosporangiaceae; Nonomuraea
Average proteome isoelectric point is 6.49
Get precalculated fractions of proteins
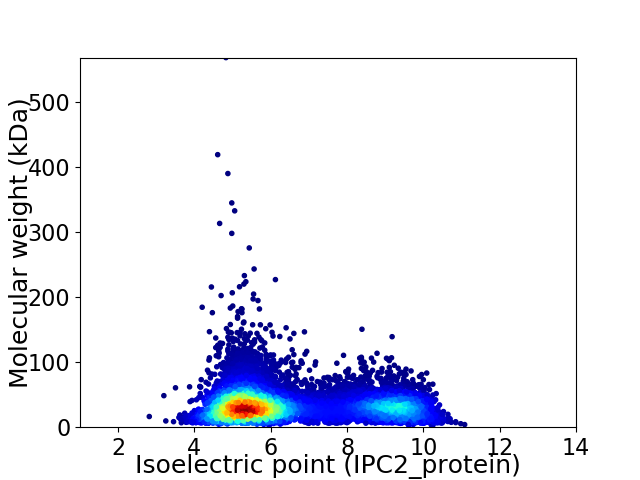
Virtual 2D-PAGE plot for 9721 proteins (isoelectric point calculated using IPC2_protein)
Get csv file with sequences according to given criteria:
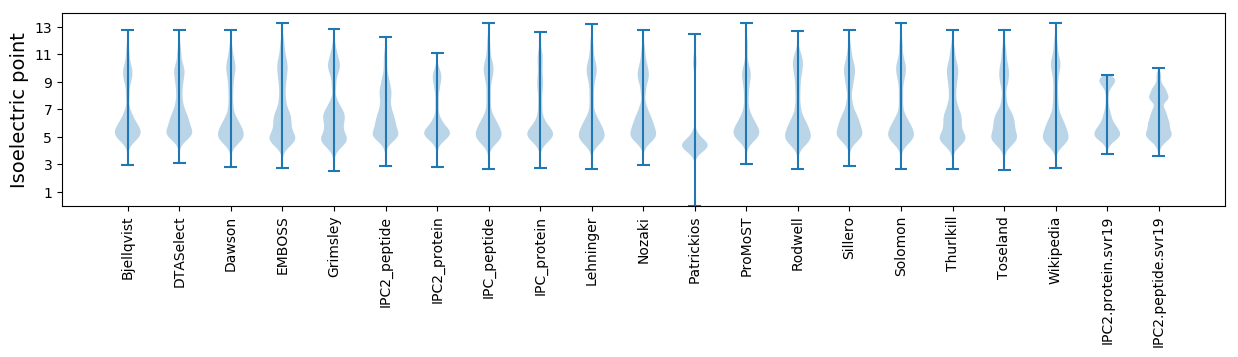
* You can choose from 21 different methods for calculating isoelectric point
Summary statistics related to proteome-wise predictions
Protein with the lowest isoelectric point:
>tr|A0A5C4VMQ9|A0A5C4VMQ9_9ACTN Methylamine utilization protein MauE OS=Nonomuraea phyllanthi OX=2219224 GN=FH608_039065 PE=4 SV=1
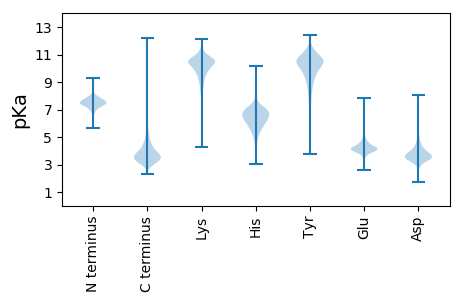
MM1 pKa = 7.57SIDD4 pKa = 4.2TIQVADD10 pKa = 5.23PIAFAGAHH18 pKa = 5.98ALDD21 pKa = 4.54TRR23 pKa = 11.84SQDD26 pKa = 3.55PADD29 pKa = 3.52IALMDD34 pKa = 4.51EE35 pKa = 4.41FDD37 pKa = 4.98LDD39 pKa = 3.78ILVSSMPGEE48 pKa = 3.98IRR50 pKa = 11.84AGEE53 pKa = 4.05CDD55 pKa = 2.79RR56 pKa = 11.84WSNCVCITVCATHH69 pKa = 6.82PWSCAA74 pKa = 3.17
MM1 pKa = 7.57SIDD4 pKa = 4.2TIQVADD10 pKa = 5.23PIAFAGAHH18 pKa = 5.98ALDD21 pKa = 4.54TRR23 pKa = 11.84SQDD26 pKa = 3.55PADD29 pKa = 3.52IALMDD34 pKa = 4.51EE35 pKa = 4.41FDD37 pKa = 4.98LDD39 pKa = 3.78ILVSSMPGEE48 pKa = 3.98IRR50 pKa = 11.84AGEE53 pKa = 4.05CDD55 pKa = 2.79RR56 pKa = 11.84WSNCVCITVCATHH69 pKa = 6.82PWSCAA74 pKa = 3.17
Molecular weight: 7.97 kDa
Isoelectric point according different methods:
Protein with the highest isoelectric point:
>tr|A0A5C4VXC6|A0A5C4VXC6_9ACTN NADH-quinone oxidoreductase subunit NuoE OS=Nonomuraea phyllanthi OX=2219224 GN=nuoE PE=3 SV=1
MM1 pKa = 7.4GSVIKK6 pKa = 10.42KK7 pKa = 8.47RR8 pKa = 11.84RR9 pKa = 11.84KK10 pKa = 9.22RR11 pKa = 11.84MAKK14 pKa = 9.41KK15 pKa = 9.99KK16 pKa = 9.77HH17 pKa = 5.81RR18 pKa = 11.84KK19 pKa = 8.55LLKK22 pKa = 8.44KK23 pKa = 9.17TRR25 pKa = 11.84IQRR28 pKa = 11.84RR29 pKa = 11.84NKK31 pKa = 9.73KK32 pKa = 9.84
MM1 pKa = 7.4GSVIKK6 pKa = 10.42KK7 pKa = 8.47RR8 pKa = 11.84RR9 pKa = 11.84KK10 pKa = 9.22RR11 pKa = 11.84MAKK14 pKa = 9.41KK15 pKa = 9.99KK16 pKa = 9.77HH17 pKa = 5.81RR18 pKa = 11.84KK19 pKa = 8.55LLKK22 pKa = 8.44KK23 pKa = 9.17TRR25 pKa = 11.84IQRR28 pKa = 11.84RR29 pKa = 11.84NKK31 pKa = 9.73KK32 pKa = 9.84
Molecular weight: 4.03 kDa
Isoelectric point according different methods:
Peptides (in silico digests for buttom-up proteomics)
Below you can find in silico digests of the whole proteome with Trypsin, Chymotrypsin, Trypsin+LysC, LysN, ArgC proteases suitable for different mass spec machines.| Try ESI |
 |
|---|
| ChTry ESI |
|
|---|
| ArgC ESI |
|
|---|
| LysN ESI |
|
|---|
| TryLysC ESI |
|
|---|
| Try MALDI |
|
|---|
| ChTry MALDI |
|
|---|
| ArgC MALDI |
|
|---|
| LysN MALDI |
|
|---|
| TryLysC MALDI |
|
|---|
| Try LTQ |
|
|---|
| ChTry LTQ |
|
|---|
| ArgC LTQ |
|
|---|
| LysN LTQ |
|
|---|
| TryLysC LTQ |
|
|---|
| Try MSlow |
|
|---|
| ChTry MSlow |
|
|---|
| ArgC MSlow |
|
|---|
| LysN MSlow |
|
|---|
| TryLysC MSlow |
|
|---|
| Try MShigh |
|
|---|
| ChTry MShigh |
|
|---|
| ArgC MShigh |
|
|---|
| LysN MShigh |
|
|---|
| TryLysC MShigh |
|
|---|
General Statistics
Number of major isoforms |
Number of additional isoforms |
Number of all proteins |
Number of amino acids |
Min. Seq. Length |
Max. Seq. Length |
Avg. Seq. Length |
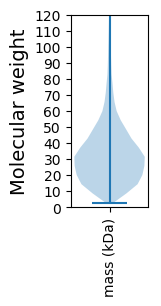
Avg. Mol. Weight |
|---|---|---|---|---|---|---|---|
0 |
3182504 |
27 |
5419 |
327.4 |
35.19 |
Amino acid frequency
Ala |
Cys |
Asp |
Glu |
Phe |
Gly |
His |
Ile |
Lys |
Leu |
|---|---|---|---|---|---|---|---|---|---|
13.331 ± 0.036 | 0.776 ± 0.006 |
5.8 ± 0.02 | 5.674 ± 0.024 |
2.829 ± 0.015 | 9.399 ± 0.023 |
2.248 ± 0.013 | 3.536 ± 0.016 |
2.001 ± 0.021 | 10.599 ± 0.033 |
Met |
Asn |
Gln |
Pro |
Arg |
Ser |
Thr |
Val |
Trp |
Tyr |
|---|---|---|---|---|---|---|---|---|---|
1.91 ± 0.011 | 1.758 ± 0.014 |
5.998 ± 0.022 | 2.694 ± 0.013 |
8.266 ± 0.031 | 5.034 ± 0.019 |
5.734 ± 0.024 | 8.632 ± 0.022 |
1.6 ± 0.012 | 2.179 ± 0.013 |
Most of the basic statistics you can see at this page can be downloaded from this CSV file
See this proteome in:

Proteome-pI is available under Creative Commons Attribution-NoDerivs license, for more details see here
| Reference: Kozlowski LP. Proteome-pI 2.0: Proteome Isoelectric Point Database Update. Nucleic Acids Res. 2021, doi: 10.1093/nar/gkab944 | Contact: Lukasz P. Kozlowski |