Fibularhizoctonia sp. CBS 109695
Taxonomy: cellular organisms; Eukaryota; Opisthokonta; Fungi; Dikarya; Basidiomycota; Agaricomycotina; Agaricomycetes; Agaricomycetidae; Atheliales; Atheliaceae; Fibularhizoctonia; unclassified Fibularhizoctonia
Average proteome isoelectric point is 6.83
Get precalculated fractions of proteins
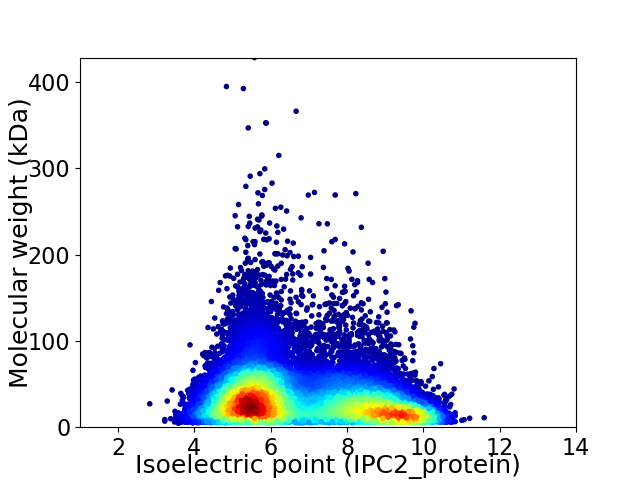
Virtual 2D-PAGE plot for 31941 proteins (isoelectric point calculated using IPC2_protein)
Get csv file with sequences according to given criteria:
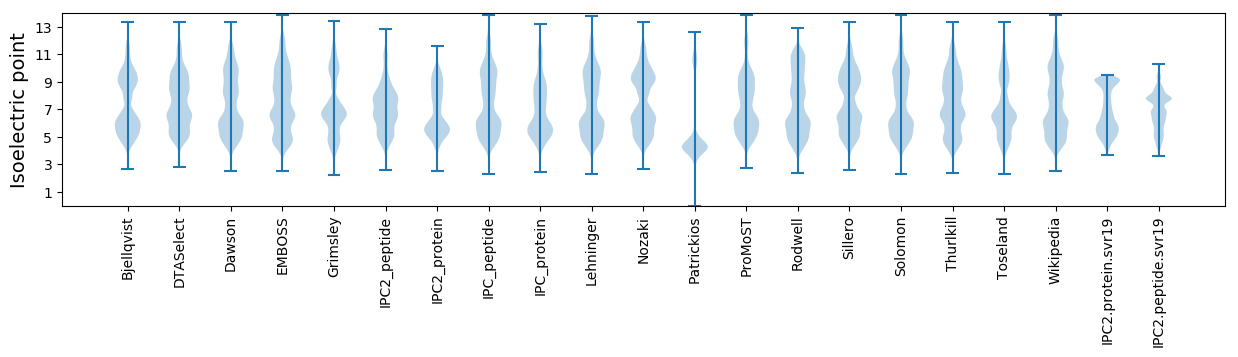
* You can choose from 21 different methods for calculating isoelectric point
Summary statistics related to proteome-wise predictions
Protein with the lowest isoelectric point:
>tr|A0A166MQZ6|A0A166MQZ6_9AGAM TFIIIC_sub6 domain-containing protein OS=Fibularhizoctonia sp. CBS 109695 OX=436010 GN=FIBSPDRAFT_735970 PE=4 SV=1
MM1 pKa = 7.56SSKK4 pKa = 8.94QTSSGSGYY12 pKa = 10.9AKK14 pKa = 10.71NSVTGSGSNDD24 pKa = 3.45QGNHH28 pKa = 4.26YY29 pKa = 7.64CTRR32 pKa = 11.84EE33 pKa = 3.84DD34 pKa = 3.37SAGNSGYY41 pKa = 10.53HH42 pKa = 5.64YY43 pKa = 10.5SNKK46 pKa = 10.3DD47 pKa = 2.8GSYY50 pKa = 10.64YY51 pKa = 9.67YY52 pKa = 10.51QNPDD56 pKa = 2.48GSKK59 pKa = 10.19YY60 pKa = 10.54YY61 pKa = 10.23EE62 pKa = 4.03NKK64 pKa = 10.41AGNSKK69 pKa = 8.64YY70 pKa = 9.28TNPRR74 pKa = 11.84GDD76 pKa = 3.7TYY78 pKa = 11.45VKK80 pKa = 10.48SSSATVANDD89 pKa = 3.42HH90 pKa = 7.03GDD92 pKa = 3.42IQDD95 pKa = 4.45DD96 pKa = 3.95RR97 pKa = 11.84NGDD100 pKa = 3.55HH101 pKa = 7.19SSAAAEE107 pKa = 4.54DD108 pKa = 4.72GSDD111 pKa = 3.51GGHH114 pKa = 6.89ASDD117 pKa = 5.28AGHH120 pKa = 5.96SHH122 pKa = 7.49DD123 pKa = 4.95GSSDD127 pKa = 3.74SEE129 pKa = 4.61GSGSRR134 pKa = 11.84PDD136 pKa = 4.19AGQEE140 pKa = 3.99DD141 pKa = 4.8AVDD144 pKa = 4.0DD145 pKa = 4.32TDD147 pKa = 6.22DD148 pKa = 3.97EE149 pKa = 6.04SDD151 pKa = 4.23DD152 pKa = 4.12EE153 pKa = 5.27GSASLPNSDD162 pKa = 4.8EE163 pKa = 4.22EE164 pKa = 5.02GSLDD168 pKa = 4.32SPGGSDD174 pKa = 3.65DD175 pKa = 4.15SEE177 pKa = 4.72SAGEE181 pKa = 3.94SDD183 pKa = 4.51EE184 pKa = 4.61YY185 pKa = 11.63SDD187 pKa = 5.74DD188 pKa = 4.78FEE190 pKa = 7.19DD191 pKa = 4.08EE192 pKa = 4.13
MM1 pKa = 7.56SSKK4 pKa = 8.94QTSSGSGYY12 pKa = 10.9AKK14 pKa = 10.71NSVTGSGSNDD24 pKa = 3.45QGNHH28 pKa = 4.26YY29 pKa = 7.64CTRR32 pKa = 11.84EE33 pKa = 3.84DD34 pKa = 3.37SAGNSGYY41 pKa = 10.53HH42 pKa = 5.64YY43 pKa = 10.5SNKK46 pKa = 10.3DD47 pKa = 2.8GSYY50 pKa = 10.64YY51 pKa = 9.67YY52 pKa = 10.51QNPDD56 pKa = 2.48GSKK59 pKa = 10.19YY60 pKa = 10.54YY61 pKa = 10.23EE62 pKa = 4.03NKK64 pKa = 10.41AGNSKK69 pKa = 8.64YY70 pKa = 9.28TNPRR74 pKa = 11.84GDD76 pKa = 3.7TYY78 pKa = 11.45VKK80 pKa = 10.48SSSATVANDD89 pKa = 3.42HH90 pKa = 7.03GDD92 pKa = 3.42IQDD95 pKa = 4.45DD96 pKa = 3.95RR97 pKa = 11.84NGDD100 pKa = 3.55HH101 pKa = 7.19SSAAAEE107 pKa = 4.54DD108 pKa = 4.72GSDD111 pKa = 3.51GGHH114 pKa = 6.89ASDD117 pKa = 5.28AGHH120 pKa = 5.96SHH122 pKa = 7.49DD123 pKa = 4.95GSSDD127 pKa = 3.74SEE129 pKa = 4.61GSGSRR134 pKa = 11.84PDD136 pKa = 4.19AGQEE140 pKa = 3.99DD141 pKa = 4.8AVDD144 pKa = 4.0DD145 pKa = 4.32TDD147 pKa = 6.22DD148 pKa = 3.97EE149 pKa = 6.04SDD151 pKa = 4.23DD152 pKa = 4.12EE153 pKa = 5.27GSASLPNSDD162 pKa = 4.8EE163 pKa = 4.22EE164 pKa = 5.02GSLDD168 pKa = 4.32SPGGSDD174 pKa = 3.65DD175 pKa = 4.15SEE177 pKa = 4.72SAGEE181 pKa = 3.94SDD183 pKa = 4.51EE184 pKa = 4.61YY185 pKa = 11.63SDD187 pKa = 5.74DD188 pKa = 4.78FEE190 pKa = 7.19DD191 pKa = 4.08EE192 pKa = 4.13
Molecular weight: 19.94 kDa
Isoelectric point according different methods:
Protein with the highest isoelectric point:
>tr|A0A167XPE2|A0A167XPE2_9AGAM CHAT domain-containing protein (Fragment) OS=Fibularhizoctonia sp. CBS 109695 OX=436010 GN=FIBSPDRAFT_762943 PE=4 SV=1
MM1 pKa = 7.12GRR3 pKa = 11.84WAGLYY8 pKa = 9.25RR9 pKa = 11.84ARR11 pKa = 11.84IALRR15 pKa = 11.84PGRR18 pKa = 11.84SSQLVRR24 pKa = 11.84RR25 pKa = 11.84PLSAASRR32 pKa = 11.84SRR34 pKa = 11.84FRR36 pKa = 11.84PSLVAAPAAARR47 pKa = 11.84RR48 pKa = 11.84SSPVARR54 pKa = 11.84RR55 pKa = 11.84PSPVARR61 pKa = 11.84RR62 pKa = 11.84SSPVARR68 pKa = 11.84RR69 pKa = 11.84PSPVARR75 pKa = 11.84RR76 pKa = 11.84LSVAARR82 pKa = 11.84RR83 pKa = 11.84RR84 pKa = 11.84AGCWSLRR91 pKa = 11.84RR92 pKa = 11.84PLL94 pKa = 3.77
MM1 pKa = 7.12GRR3 pKa = 11.84WAGLYY8 pKa = 9.25RR9 pKa = 11.84ARR11 pKa = 11.84IALRR15 pKa = 11.84PGRR18 pKa = 11.84SSQLVRR24 pKa = 11.84RR25 pKa = 11.84PLSAASRR32 pKa = 11.84SRR34 pKa = 11.84FRR36 pKa = 11.84PSLVAAPAAARR47 pKa = 11.84RR48 pKa = 11.84SSPVARR54 pKa = 11.84RR55 pKa = 11.84PSPVARR61 pKa = 11.84RR62 pKa = 11.84SSPVARR68 pKa = 11.84RR69 pKa = 11.84PSPVARR75 pKa = 11.84RR76 pKa = 11.84LSVAARR82 pKa = 11.84RR83 pKa = 11.84RR84 pKa = 11.84AGCWSLRR91 pKa = 11.84RR92 pKa = 11.84PLL94 pKa = 3.77
Molecular weight: 10.4 kDa
Isoelectric point according different methods:
Peptides (in silico digests for buttom-up proteomics)
Below you can find in silico digests of the whole proteome with Trypsin, Chymotrypsin, Trypsin+LysC, LysN, ArgC proteases suitable for different mass spec machines.| Try ESI |
 |
|---|
| ChTry ESI |
|
|---|
| ArgC ESI |
|
|---|
| LysN ESI |
|
|---|
| TryLysC ESI |
|
|---|
| Try MALDI |
|
|---|
| ChTry MALDI |
|
|---|
| ArgC MALDI |
|
|---|
| LysN MALDI |
|
|---|
| TryLysC MALDI |
|
|---|
| Try LTQ |
|
|---|
| ChTry LTQ |
|
|---|
| ArgC LTQ |
|
|---|
| LysN LTQ |
|
|---|
| TryLysC LTQ |
|
|---|
| Try MSlow |
|
|---|
| ChTry MSlow |
|
|---|
| ArgC MSlow |
|
|---|
| LysN MSlow |
|
|---|
| TryLysC MSlow |
|
|---|
| Try MShigh |
|
|---|
| ChTry MShigh |
|
|---|
| ArgC MShigh |
|
|---|
| LysN MShigh |
|
|---|
| TryLysC MShigh |
|
|---|
General Statistics
Number of major isoforms |
Number of additional isoforms |
Number of all proteins |
Number of amino acids |
Min. Seq. Length |
Max. Seq. Length |
Avg. Seq. Length |
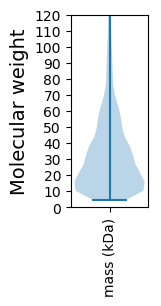
Avg. Mol. Weight |
|---|---|---|---|---|---|---|---|
10750530 |
49 |
5067 |
336.6 |
37.06 |
Amino acid frequency
Ala |
Cys |
Asp |
Glu |
Phe |
Gly |
His |
Ile |
Lys |
Leu |
|---|---|---|---|---|---|---|---|---|---|
9.445 ± 0.013 | 1.522 ± 0.008 |
5.362 ± 0.011 | 5.467 ± 0.013 |
3.623 ± 0.008 | 6.753 ± 0.014 |
2.771 ± 0.007 | 4.959 ± 0.011 |
4.164 ± 0.013 | 9.298 ± 0.017 |
Met |
Asn |
Gln |
Pro |
Arg |
Ser |
Thr |
Val |
Trp |
Tyr |
|---|---|---|---|---|---|---|---|---|---|
2.199 ± 0.005 | 3.29 ± 0.008 |
6.298 ± 0.015 | 3.69 ± 0.009 |
6.232 ± 0.012 | 8.352 ± 0.018 |
6.089 ± 0.012 | 6.301 ± 0.011 |
1.554 ± 0.006 | 2.628 ± 0.007 |
Most of the basic statistics you can see at this page can be downloaded from this CSV file
See this proteome in:

Proteome-pI is available under Creative Commons Attribution-NoDerivs license, for more details see here
| Reference: Kozlowski LP. Proteome-pI 2.0: Proteome Isoelectric Point Database Update. Nucleic Acids Res. 2021, doi: 10.1093/nar/gkab944 | Contact: Lukasz P. Kozlowski |