Acetivibrio saccincola
Taxonomy: cellular organisms; Bacteria; Terrabacteria group; Firmicutes; Clostridia; Eubacteriales; Oscillosp
Average proteome isoelectric point is 6.44
Get precalculated fractions of proteins
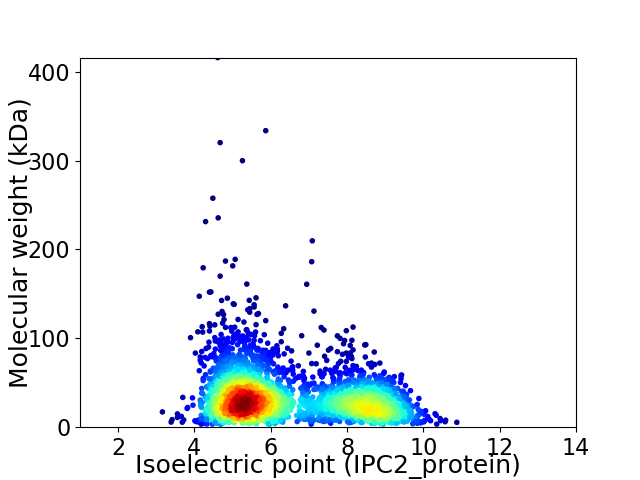
Virtual 2D-PAGE plot for 3020 proteins (isoelectric point calculated using IPC2_protein)
Get csv file with sequences according to given criteria:
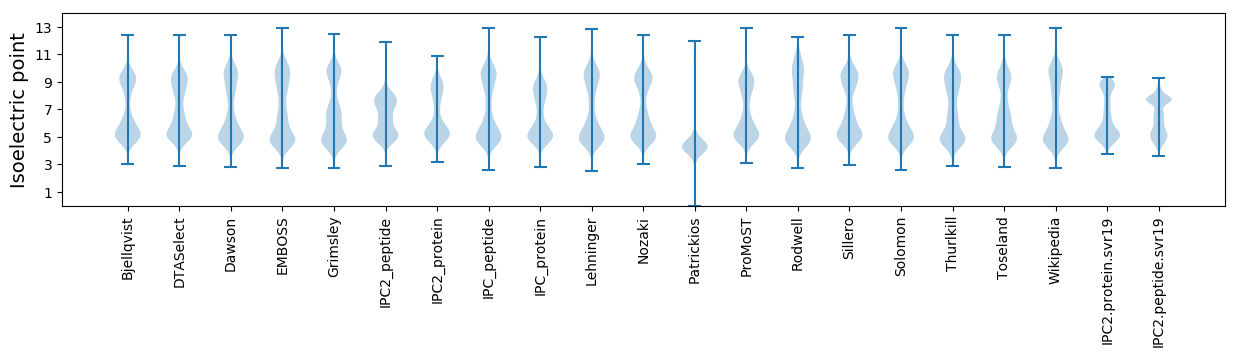
* You can choose from 21 different methods for calculating isoelectric point
Summary statistics related to proteome-wise predictions
Protein with the lowest isoelectric point:
>tr|A0A2K9E8F9|A0A2K9E8F9_9FIRM Uncharacterized protein OS=Acetivibrio saccincola OX=1677857 GN=B9R14_04590 PE=4 SV=1
MM1 pKa = 6.99MVCLFIFSAFSLLNITGVLAEE22 pKa = 4.34EE23 pKa = 4.91DD24 pKa = 4.0VLSVLDD30 pKa = 3.95FEE32 pKa = 6.3DD33 pKa = 3.57YY34 pKa = 10.57FYY36 pKa = 11.61YY37 pKa = 10.65EE38 pKa = 4.61DD39 pKa = 3.7GNYY42 pKa = 10.23VLTSDD47 pKa = 3.92IVVDD51 pKa = 3.29SSFRR55 pKa = 11.84IDD57 pKa = 3.06GHH59 pKa = 4.7TVVLNGYY66 pKa = 9.93SMTVEE71 pKa = 4.16GDD73 pKa = 3.42LCIDD77 pKa = 4.03NGSLDD82 pKa = 4.23LGSGSLTVNGDD93 pKa = 3.41FYY95 pKa = 11.2INGFDD100 pKa = 3.54TSNPAVLDD108 pKa = 3.7INNGNLIIEE117 pKa = 4.75GNFDD121 pKa = 3.34TYY123 pKa = 11.85DD124 pKa = 3.44NVILYY129 pKa = 7.3MVQEE133 pKa = 3.91NDD135 pKa = 3.24YY136 pKa = 11.24VLVHH140 pKa = 6.79KK141 pKa = 10.54DD142 pKa = 3.38FYY144 pKa = 10.92FNSFIPHH151 pKa = 6.58GDD153 pKa = 3.35YY154 pKa = 10.99LINGTLEE161 pKa = 4.26VKK163 pKa = 10.7GDD165 pKa = 3.75FYY167 pKa = 11.75DD168 pKa = 4.57FSKK171 pKa = 11.57GNFLPSQNHH180 pKa = 4.62RR181 pKa = 11.84VVLSGEE187 pKa = 3.95DD188 pKa = 3.39VQYY191 pKa = 10.33VTFEE195 pKa = 4.11YY196 pKa = 10.54PEE198 pKa = 4.4LSSFNILEE206 pKa = 4.09LTKK209 pKa = 10.19PLEE212 pKa = 4.05TGYY215 pKa = 10.73VFSHH219 pKa = 5.26TPVWNTLIEE228 pKa = 4.86PGTSFKK234 pKa = 11.09PGDD237 pKa = 3.74LDD239 pKa = 4.35GNGTVDD245 pKa = 3.47STDD248 pKa = 2.89ATILKK253 pKa = 9.72RR254 pKa = 11.84YY255 pKa = 8.17IVSIIDD261 pKa = 4.29EE262 pKa = 4.42IPAGNDD268 pKa = 3.1AADD271 pKa = 3.91LNGDD275 pKa = 3.78GDD277 pKa = 4.43IDD279 pKa = 4.17SLDD282 pKa = 3.53YY283 pKa = 10.95TLLNRR288 pKa = 11.84FILGMITEE296 pKa = 4.78FPVNRR301 pKa = 4.3
MM1 pKa = 6.99MVCLFIFSAFSLLNITGVLAEE22 pKa = 4.34EE23 pKa = 4.91DD24 pKa = 4.0VLSVLDD30 pKa = 3.95FEE32 pKa = 6.3DD33 pKa = 3.57YY34 pKa = 10.57FYY36 pKa = 11.61YY37 pKa = 10.65EE38 pKa = 4.61DD39 pKa = 3.7GNYY42 pKa = 10.23VLTSDD47 pKa = 3.92IVVDD51 pKa = 3.29SSFRR55 pKa = 11.84IDD57 pKa = 3.06GHH59 pKa = 4.7TVVLNGYY66 pKa = 9.93SMTVEE71 pKa = 4.16GDD73 pKa = 3.42LCIDD77 pKa = 4.03NGSLDD82 pKa = 4.23LGSGSLTVNGDD93 pKa = 3.41FYY95 pKa = 11.2INGFDD100 pKa = 3.54TSNPAVLDD108 pKa = 3.7INNGNLIIEE117 pKa = 4.75GNFDD121 pKa = 3.34TYY123 pKa = 11.85DD124 pKa = 3.44NVILYY129 pKa = 7.3MVQEE133 pKa = 3.91NDD135 pKa = 3.24YY136 pKa = 11.24VLVHH140 pKa = 6.79KK141 pKa = 10.54DD142 pKa = 3.38FYY144 pKa = 10.92FNSFIPHH151 pKa = 6.58GDD153 pKa = 3.35YY154 pKa = 10.99LINGTLEE161 pKa = 4.26VKK163 pKa = 10.7GDD165 pKa = 3.75FYY167 pKa = 11.75DD168 pKa = 4.57FSKK171 pKa = 11.57GNFLPSQNHH180 pKa = 4.62RR181 pKa = 11.84VVLSGEE187 pKa = 3.95DD188 pKa = 3.39VQYY191 pKa = 10.33VTFEE195 pKa = 4.11YY196 pKa = 10.54PEE198 pKa = 4.4LSSFNILEE206 pKa = 4.09LTKK209 pKa = 10.19PLEE212 pKa = 4.05TGYY215 pKa = 10.73VFSHH219 pKa = 5.26TPVWNTLIEE228 pKa = 4.86PGTSFKK234 pKa = 11.09PGDD237 pKa = 3.74LDD239 pKa = 4.35GNGTVDD245 pKa = 3.47STDD248 pKa = 2.89ATILKK253 pKa = 9.72RR254 pKa = 11.84YY255 pKa = 8.17IVSIIDD261 pKa = 4.29EE262 pKa = 4.42IPAGNDD268 pKa = 3.1AADD271 pKa = 3.91LNGDD275 pKa = 3.78GDD277 pKa = 4.43IDD279 pKa = 4.17SLDD282 pKa = 3.53YY283 pKa = 10.95TLLNRR288 pKa = 11.84FILGMITEE296 pKa = 4.78FPVNRR301 pKa = 4.3
Molecular weight: 33.52 kDa
Isoelectric point according different methods:
Protein with the highest isoelectric point:
>tr|A0A2K9E631|A0A2K9E631_9FIRM Arginine decarboxylase OS=Acetivibrio saccincola OX=1677857 GN=speA2 PE=3 SV=1
MM1 pKa = 7.45LRR3 pKa = 11.84TYY5 pKa = 9.8QPKK8 pKa = 9.46KK9 pKa = 8.28RR10 pKa = 11.84QRR12 pKa = 11.84KK13 pKa = 8.39KK14 pKa = 8.49EE15 pKa = 3.5HH16 pKa = 6.11GFRR19 pKa = 11.84KK20 pKa = 9.77RR21 pKa = 11.84MKK23 pKa = 8.64TSNGRR28 pKa = 11.84KK29 pKa = 7.18VLRR32 pKa = 11.84RR33 pKa = 11.84RR34 pKa = 11.84RR35 pKa = 11.84LKK37 pKa = 10.26GRR39 pKa = 11.84KK40 pKa = 8.78VLSAA44 pKa = 4.05
MM1 pKa = 7.45LRR3 pKa = 11.84TYY5 pKa = 9.8QPKK8 pKa = 9.46KK9 pKa = 8.28RR10 pKa = 11.84QRR12 pKa = 11.84KK13 pKa = 8.39KK14 pKa = 8.49EE15 pKa = 3.5HH16 pKa = 6.11GFRR19 pKa = 11.84KK20 pKa = 9.77RR21 pKa = 11.84MKK23 pKa = 8.64TSNGRR28 pKa = 11.84KK29 pKa = 7.18VLRR32 pKa = 11.84RR33 pKa = 11.84RR34 pKa = 11.84RR35 pKa = 11.84LKK37 pKa = 10.26GRR39 pKa = 11.84KK40 pKa = 8.78VLSAA44 pKa = 4.05
Molecular weight: 5.47 kDa
Isoelectric point according different methods:
Peptides (in silico digests for buttom-up proteomics)
Below you can find in silico digests of the whole proteome with Trypsin, Chymotrypsin, Trypsin+LysC, LysN, ArgC proteases suitable for different mass spec machines.| Try ESI |
 |
|---|
| ChTry ESI |
|
|---|
| ArgC ESI |
|
|---|
| LysN ESI |
|
|---|
| TryLysC ESI |
|
|---|
| Try MALDI |
|
|---|
| ChTry MALDI |
|
|---|
| ArgC MALDI |
|
|---|
| LysN MALDI |
|
|---|
| TryLysC MALDI |
|
|---|
| Try LTQ |
|
|---|
| ChTry LTQ |
|
|---|
| ArgC LTQ |
|
|---|
| LysN LTQ |
|
|---|
| TryLysC LTQ |
|
|---|
| Try MSlow |
|
|---|
| ChTry MSlow |
|
|---|
| ArgC MSlow |
|
|---|
| LysN MSlow |
|
|---|
| TryLysC MSlow |
|
|---|
| Try MShigh |
|
|---|
| ChTry MShigh |
|
|---|
| ArgC MShigh |
|
|---|
| LysN MShigh |
|
|---|
| TryLysC MShigh |
|
|---|
General Statistics
Number of major isoforms |
Number of additional isoforms |
Number of all proteins |
Number of amino acids |
Min. Seq. Length |
Max. Seq. Length |
Avg. Seq. Length |
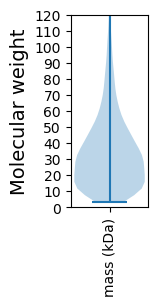
Avg. Mol. Weight |
|---|---|---|---|---|---|---|---|
0 |
967809 |
29 |
3652 |
320.5 |
36.28 |
Amino acid frequency
Ala |
Cys |
Asp |
Glu |
Phe |
Gly |
His |
Ile |
Lys |
Leu |
|---|---|---|---|---|---|---|---|---|---|
5.703 ± 0.043 | 1.063 ± 0.015 |
5.81 ± 0.034 | 7.985 ± 0.042 |
4.385 ± 0.033 | 6.643 ± 0.048 |
1.469 ± 0.018 | 9.06 ± 0.039 |
8.574 ± 0.054 | 8.499 ± 0.048 |
Met |
Asn |
Gln |
Pro |
Arg |
Ser |
Thr |
Val |
Trp |
Tyr |
|---|---|---|---|---|---|---|---|---|---|
2.462 ± 0.019 | 5.569 ± 0.04 |
3.286 ± 0.032 | 2.393 ± 0.024 |
4.047 ± 0.033 | 6.111 ± 0.033 |
4.946 ± 0.048 | 6.832 ± 0.039 |
0.877 ± 0.015 | 4.287 ± 0.034 |
Most of the basic statistics you can see at this page can be downloaded from this CSV file
See this proteome in:

Proteome-pI is available under Creative Commons Attribution-NoDerivs license, for more details see here
| Reference: Kozlowski LP. Proteome-pI 2.0: Proteome Isoelectric Point Database Update. Nucleic Acids Res. 2021, doi: 10.1093/nar/gkab944 | Contact: Lukasz P. Kozlowski |