Mycobacterium virus PMC
Taxonomy: Viruses; Duplodnaviria; Heunggongvirae; Uroviricota; Caudoviricetes; Caudovirales; Siphoviridae; Cheoctovirus
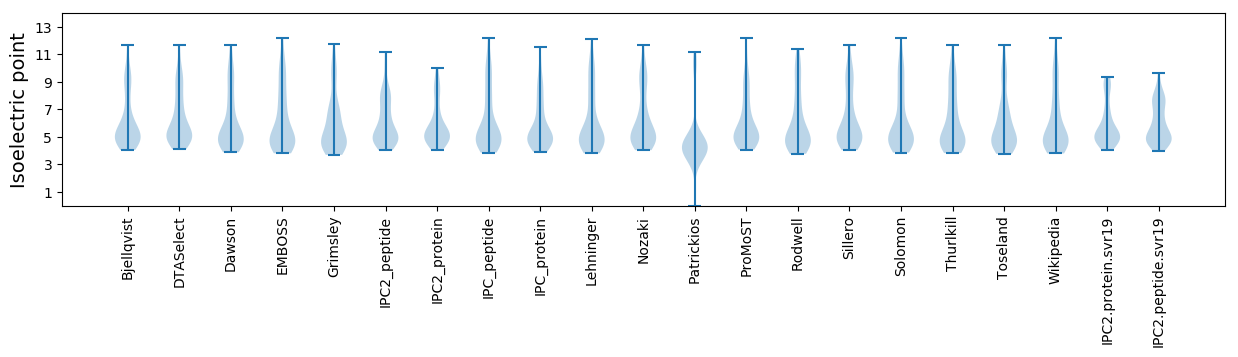
Average proteome isoelectric point is 5.95
Get precalculated fractions of proteins
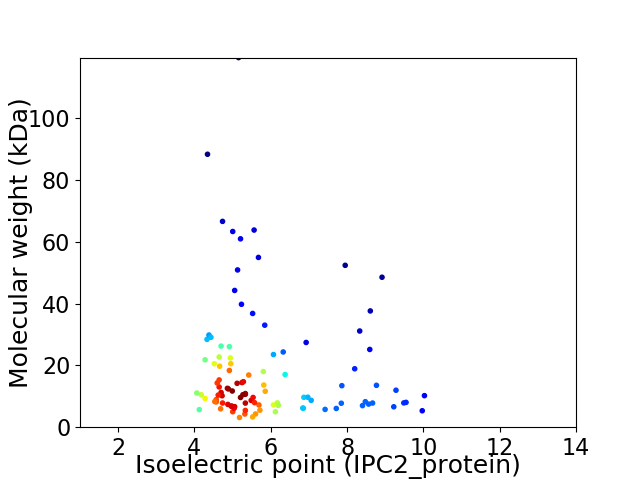
Virtual 2D-PAGE plot for 104 proteins (isoelectric point calculated using IPC2_protein)
Get csv file with sequences according to given criteria:
* You can choose from 21 different methods for calculating isoelectric point
Summary statistics related to proteome-wise predictions
Protein with the lowest isoelectric point:
>tr|Q19YH8|Q19YH8_9CAUD Uncharacterized protein OS=Mycobacterium virus PMC OX=373412 GN=75 PE=4 SV=1
MM1 pKa = 7.92SGEE4 pKa = 4.04INPEE8 pKa = 3.43GFTRR12 pKa = 11.84YY13 pKa = 10.28GGDD16 pKa = 3.72CTCGPIYY23 pKa = 10.21TYY25 pKa = 10.79GGHH28 pKa = 7.13AEE30 pKa = 4.48PGQFDD35 pKa = 4.88PFCPDD40 pKa = 2.8HH41 pKa = 6.95GNPEE45 pKa = 4.29YY46 pKa = 10.83VASLEE51 pKa = 4.27EE52 pKa = 4.01AA53 pKa = 3.67
MM1 pKa = 7.92SGEE4 pKa = 4.04INPEE8 pKa = 3.43GFTRR12 pKa = 11.84YY13 pKa = 10.28GGDD16 pKa = 3.72CTCGPIYY23 pKa = 10.21TYY25 pKa = 10.79GGHH28 pKa = 7.13AEE30 pKa = 4.48PGQFDD35 pKa = 4.88PFCPDD40 pKa = 2.8HH41 pKa = 6.95GNPEE45 pKa = 4.29YY46 pKa = 10.83VASLEE51 pKa = 4.27EE52 pKa = 4.01AA53 pKa = 3.67
Molecular weight: 5.69 kDa
Isoelectric point according different methods:
Protein with the highest isoelectric point:
>tr|Q19YI4|Q19YI4_9CAUD Uncharacterized protein OS=Mycobacterium virus PMC OX=373412 GN=69 PE=4 SV=1
MM1 pKa = 8.0PDD3 pKa = 3.22RR4 pKa = 11.84YY5 pKa = 10.94GEE7 pKa = 4.23TTPEE11 pKa = 3.57PRR13 pKa = 11.84VFVRR17 pKa = 11.84PKK19 pKa = 10.42VNALTVRR26 pKa = 11.84CSWCKK31 pKa = 9.72AGVGARR37 pKa = 11.84CVVAGTNLVLQRR49 pKa = 11.84SSFHH53 pKa = 5.62EE54 pKa = 3.84ARR56 pKa = 11.84VRR58 pKa = 11.84AAEE61 pKa = 3.98LAATGALTRR70 pKa = 11.84GRR72 pKa = 11.84MSS74 pKa = 2.99
MM1 pKa = 8.0PDD3 pKa = 3.22RR4 pKa = 11.84YY5 pKa = 10.94GEE7 pKa = 4.23TTPEE11 pKa = 3.57PRR13 pKa = 11.84VFVRR17 pKa = 11.84PKK19 pKa = 10.42VNALTVRR26 pKa = 11.84CSWCKK31 pKa = 9.72AGVGARR37 pKa = 11.84CVVAGTNLVLQRR49 pKa = 11.84SSFHH53 pKa = 5.62EE54 pKa = 3.84ARR56 pKa = 11.84VRR58 pKa = 11.84AAEE61 pKa = 3.98LAATGALTRR70 pKa = 11.84GRR72 pKa = 11.84MSS74 pKa = 2.99
Molecular weight: 8.03 kDa
Isoelectric point according different methods:
Peptides (in silico digests for buttom-up proteomics)
Below you can find in silico digests of the whole proteome with Trypsin, Chymotrypsin, Trypsin+LysC, LysN, ArgC proteases suitable for different mass spec machines.| Try ESI |
 |
|---|
| ChTry ESI |
|
|---|
| ArgC ESI |
|
|---|
| LysN ESI |
|
|---|
| TryLysC ESI |
|
|---|
| Try MALDI |
|
|---|
| ChTry MALDI |
|
|---|
| ArgC MALDI |
|
|---|
| LysN MALDI |
|
|---|
| TryLysC MALDI |
|
|---|
| Try LTQ |
|
|---|
| ChTry LTQ |
|
|---|
| ArgC LTQ |
|
|---|
| LysN LTQ |
|
|---|
| TryLysC LTQ |
|
|---|
| Try MSlow |
|
|---|
| ChTry MSlow |
|
|---|
| ArgC MSlow |
|
|---|
| LysN MSlow |
|
|---|
| TryLysC MSlow |
|
|---|
| Try MShigh |
|
|---|
| ChTry MShigh |
|
|---|
| ArgC MShigh |
|
|---|
| LysN MShigh |
|
|---|
| TryLysC MShigh |
|
|---|
General Statistics
Number of major isoforms |
Number of additional isoforms |
Number of all proteins |
Number of amino acids |
Min. Seq. Length |
Max. Seq. Length |
Avg. Seq. Length |
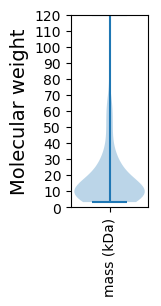
Avg. Mol. Weight |
|---|---|---|---|---|---|---|---|
0 |
17773 |
30 |
1170 |
170.9 |
18.71 |
Amino acid frequency
Ala |
Cys |
Asp |
Glu |
Phe |
Gly |
His |
Ile |
Lys |
Leu |
|---|---|---|---|---|---|---|---|---|---|
10.713 ± 0.429 | 1.266 ± 0.171 |
6.499 ± 0.294 | 5.987 ± 0.327 |
2.926 ± 0.192 | 8.704 ± 0.637 |
2.324 ± 0.193 | 4.293 ± 0.207 |
3.252 ± 0.193 | 7.376 ± 0.217 |
Met |
Asn |
Gln |
Pro |
Arg |
Ser |
Thr |
Val |
Trp |
Tyr |
|---|---|---|---|---|---|---|---|---|---|
2.144 ± 0.112 | 3.415 ± 0.175 |
6.105 ± 0.213 | 3.472 ± 0.176 |
6.915 ± 0.442 | 5.829 ± 0.33 |
6.628 ± 0.23 | 7.213 ± 0.245 |
2.436 ± 0.145 | 2.504 ± 0.136 |
Most of the basic statistics you can see at this page can be downloaded from this CSV file
See this proteome in:

Proteome-pI is available under Creative Commons Attribution-NoDerivs license, for more details see here
| Reference: Kozlowski LP. Proteome-pI 2.0: Proteome Isoelectric Point Database Update. Nucleic Acids Res. 2021, doi: 10.1093/nar/gkab944 | Contact: Lukasz P. Kozlowski |