Staphylococcus virus 3a
Taxonomy: Viruses; Duplodnaviria; Heunggongvirae; Uroviricota; Caudoviricetes; Caudovirales; Siphoviridae; Triavirus
Average proteome isoelectric point is 6.42
Get precalculated fractions of proteins
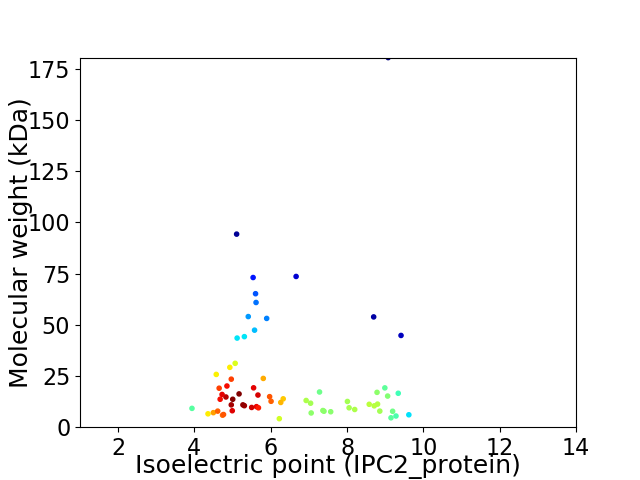
Virtual 2D-PAGE plot for 67 proteins (isoelectric point calculated using IPC2_protein)
Get csv file with sequences according to given criteria:
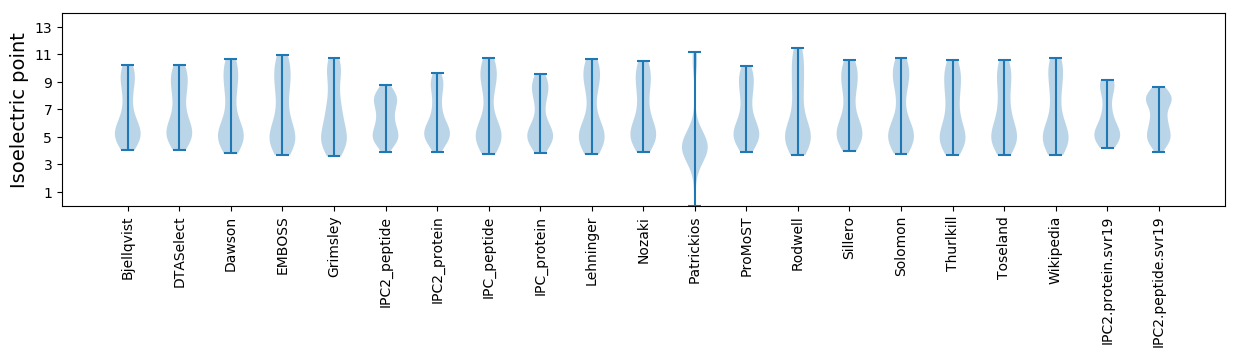
* You can choose from 21 different methods for calculating isoelectric point
Summary statistics related to proteome-wise predictions
Protein with the lowest isoelectric point:
>tr|Q4ZCN9|Q4ZCN9_9CAUD ORF047 OS=Staphylococcus virus 3a OX=215167 PE=4 SV=1
MM1 pKa = 7.51NNRR4 pKa = 11.84EE5 pKa = 4.1QIEE8 pKa = 3.98QSVISASAYY17 pKa = 10.04NGNDD21 pKa = 3.29TEE23 pKa = 4.52GLLKK27 pKa = 10.49EE28 pKa = 4.44IEE30 pKa = 4.24DD31 pKa = 4.28VYY33 pKa = 11.57KK34 pKa = 10.64KK35 pKa = 10.72AQAFDD40 pKa = 4.66EE41 pKa = 4.34ILEE44 pKa = 4.2GLPNAMQDD52 pKa = 4.46AIKK55 pKa = 10.61EE56 pKa = 4.15DD57 pKa = 3.37IGLDD61 pKa = 3.5EE62 pKa = 5.32AVGIMTGQVVYY73 pKa = 10.25KK74 pKa = 10.67YY75 pKa = 10.68EE76 pKa = 3.97EE77 pKa = 4.06EE78 pKa = 4.28QEE80 pKa = 3.93NDD82 pKa = 2.92
MM1 pKa = 7.51NNRR4 pKa = 11.84EE5 pKa = 4.1QIEE8 pKa = 3.98QSVISASAYY17 pKa = 10.04NGNDD21 pKa = 3.29TEE23 pKa = 4.52GLLKK27 pKa = 10.49EE28 pKa = 4.44IEE30 pKa = 4.24DD31 pKa = 4.28VYY33 pKa = 11.57KK34 pKa = 10.64KK35 pKa = 10.72AQAFDD40 pKa = 4.66EE41 pKa = 4.34ILEE44 pKa = 4.2GLPNAMQDD52 pKa = 4.46AIKK55 pKa = 10.61EE56 pKa = 4.15DD57 pKa = 3.37IGLDD61 pKa = 3.5EE62 pKa = 5.32AVGIMTGQVVYY73 pKa = 10.25KK74 pKa = 10.67YY75 pKa = 10.68EE76 pKa = 3.97EE77 pKa = 4.06EE78 pKa = 4.28QEE80 pKa = 3.93NDD82 pKa = 2.92
Molecular weight: 9.2 kDa
Isoelectric point according different methods:
Protein with the highest isoelectric point:
>tr|Q4ZCT7|Q4ZCT7_9CAUD ORF046 OS=Staphylococcus virus 3a OX=215167 PE=4 SV=1
MM1 pKa = 7.71TKK3 pKa = 8.07MTWNTRR9 pKa = 11.84FFVQRR14 pKa = 11.84LDD16 pKa = 3.36ISLQEE21 pKa = 3.73IMKK24 pKa = 10.31VVGTQMTNLEE34 pKa = 4.15ARR36 pKa = 11.84FLMKK40 pKa = 9.98RR41 pKa = 11.84DD42 pKa = 3.68CKK44 pKa = 10.68KK45 pKa = 10.86
MM1 pKa = 7.71TKK3 pKa = 8.07MTWNTRR9 pKa = 11.84FFVQRR14 pKa = 11.84LDD16 pKa = 3.36ISLQEE21 pKa = 3.73IMKK24 pKa = 10.31VVGTQMTNLEE34 pKa = 4.15ARR36 pKa = 11.84FLMKK40 pKa = 9.98RR41 pKa = 11.84DD42 pKa = 3.68CKK44 pKa = 10.68KK45 pKa = 10.86
Molecular weight: 5.47 kDa
Isoelectric point according different methods:
Peptides (in silico digests for buttom-up proteomics)
Below you can find in silico digests of the whole proteome with Trypsin, Chymotrypsin, Trypsin+LysC, LysN, ArgC proteases suitable for different mass spec machines.| Try ESI |
 |
|---|
| ChTry ESI |
|
|---|
| ArgC ESI |
|
|---|
| LysN ESI |
|
|---|
| TryLysC ESI |
|
|---|
| Try MALDI |
|
|---|
| ChTry MALDI |
|
|---|
| ArgC MALDI |
|
|---|
| LysN MALDI |
|
|---|
| TryLysC MALDI |
|
|---|
| Try LTQ |
|
|---|
| ChTry LTQ |
|
|---|
| ArgC LTQ |
|
|---|
| LysN LTQ |
|
|---|
| TryLysC LTQ |
|
|---|
| Try MSlow |
|
|---|
| ChTry MSlow |
|
|---|
| ArgC MSlow |
|
|---|
| LysN MSlow |
|
|---|
| TryLysC MSlow |
|
|---|
| Try MShigh |
|
|---|
| ChTry MShigh |
|
|---|
| ArgC MShigh |
|
|---|
| LysN MShigh |
|
|---|
| TryLysC MShigh |
|
|---|
General Statistics
Number of major isoforms |
Number of additional isoforms |
Number of all proteins |
Number of amino acids |
Min. Seq. Length |
Max. Seq. Length |
Avg. Seq. Length |
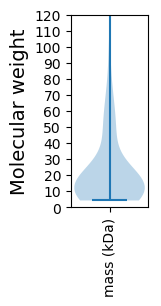
Avg. Mol. Weight |
|---|---|---|---|---|---|---|---|
0 |
13819 |
34 |
1649 |
206.3 |
23.53 |
Amino acid frequency
Ala |
Cys |
Asp |
Glu |
Phe |
Gly |
His |
Ile |
Lys |
Leu |
|---|---|---|---|---|---|---|---|---|---|
5.963 ± 0.542 | 0.543 ± 0.1 |
6.303 ± 0.212 | 7.569 ± 0.346 |
4.11 ± 0.238 | 6.071 ± 0.41 |
1.751 ± 0.151 | 7.099 ± 0.306 |
9.653 ± 0.587 | 8.597 ± 0.349 |
Met |
Asn |
Gln |
Pro |
Arg |
Ser |
Thr |
Val |
Trp |
Tyr |
|---|---|---|---|---|---|---|---|---|---|
2.518 ± 0.125 | 6.194 ± 0.266 |
2.779 ± 0.239 | 3.553 ± 0.144 |
3.958 ± 0.187 | 6.578 ± 0.33 |
5.615 ± 0.217 | 5.572 ± 0.22 |
1.274 ± 0.11 | 4.298 ± 0.333 |
Most of the basic statistics you can see at this page can be downloaded from this CSV file
See this proteome in:

Proteome-pI is available under Creative Commons Attribution-NoDerivs license, for more details see here
| Reference: Kozlowski LP. Proteome-pI 2.0: Proteome Isoelectric Point Database Update. Nucleic Acids Res. 2021, doi: 10.1093/nar/gkab944 | Contact: Lukasz P. Kozlowski |