Tabrizicola sp. TH137
Taxonomy: cellular organisms; Bacteria; Proteobacteria; Alphaproteobacteria; Rhodobacterales; Rhodobacteraceae; Tabrizicola; unclassified Tabrizicola
Average proteome isoelectric point is 6.42
Get precalculated fractions of proteins
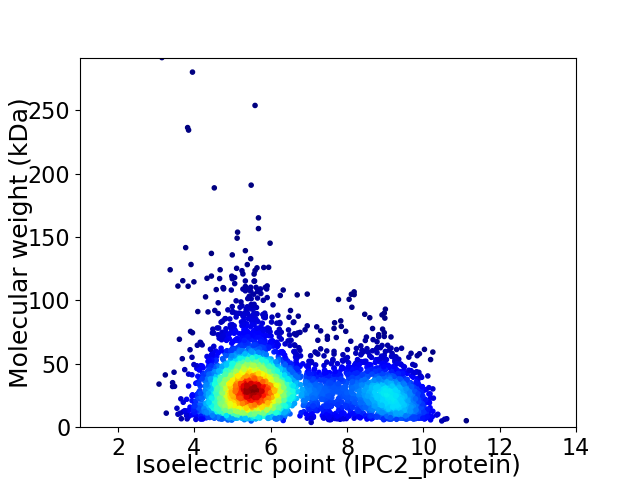
Virtual 2D-PAGE plot for 4404 proteins (isoelectric point calculated using IPC2_protein)
Get csv file with sequences according to given criteria:
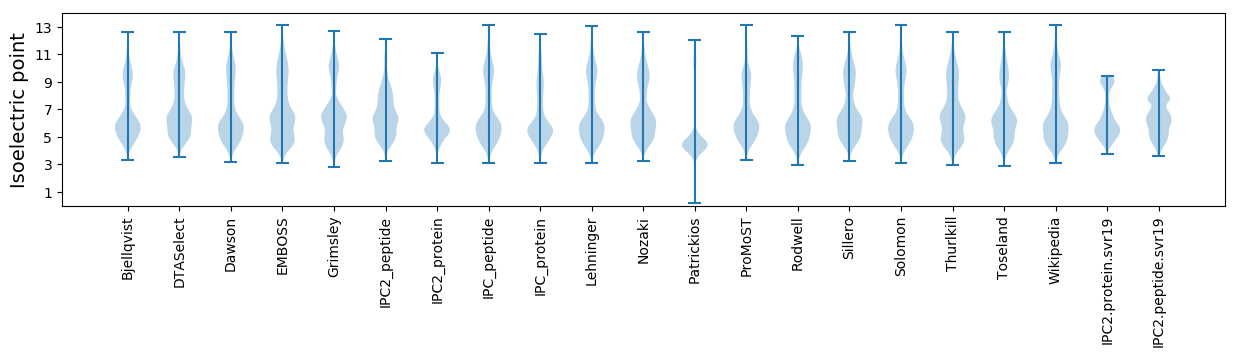
* You can choose from 21 different methods for calculating isoelectric point
Summary statistics related to proteome-wise predictions
Protein with the lowest isoelectric point:
>tr|A0A2N4YCN0|A0A2N4YCN0_9RHOB Magnesium/cobalt efflux protein OS=Tabrizicola sp. TH137 OX=2067452 GN=C0V75_19450 PE=3 SV=1
MM1 pKa = 6.89THH3 pKa = 7.49LSRR6 pKa = 11.84MASATLLAAMLASPALAQSADD27 pKa = 3.08ISTITCADD35 pKa = 4.61LATMDD40 pKa = 3.55QDD42 pKa = 5.42GITTLLFWIDD52 pKa = 3.69GYY54 pKa = 10.92MGGQAQDD61 pKa = 3.37PTFDD65 pKa = 5.18LDD67 pKa = 3.76RR68 pKa = 11.84LSANIDD74 pKa = 3.28GAIALCQQNPGSSVMDD90 pKa = 4.16ALYY93 pKa = 9.35TAEE96 pKa = 4.3NGG98 pKa = 3.58
MM1 pKa = 6.89THH3 pKa = 7.49LSRR6 pKa = 11.84MASATLLAAMLASPALAQSADD27 pKa = 3.08ISTITCADD35 pKa = 4.61LATMDD40 pKa = 3.55QDD42 pKa = 5.42GITTLLFWIDD52 pKa = 3.69GYY54 pKa = 10.92MGGQAQDD61 pKa = 3.37PTFDD65 pKa = 5.18LDD67 pKa = 3.76RR68 pKa = 11.84LSANIDD74 pKa = 3.28GAIALCQQNPGSSVMDD90 pKa = 4.16ALYY93 pKa = 9.35TAEE96 pKa = 4.3NGG98 pKa = 3.58
Molecular weight: 10.23 kDa
Isoelectric point according different methods:
Protein with the highest isoelectric point:
>tr|A0A2N4YEY6|A0A2N4YEY6_9RHOB EamA family transporter OS=Tabrizicola sp. TH137 OX=2067452 GN=C0V75_12940 PE=4 SV=1
MM1 pKa = 7.35KK2 pKa = 9.44RR3 pKa = 11.84TYY5 pKa = 10.31QPSNLVRR12 pKa = 11.84KK13 pKa = 9.18RR14 pKa = 11.84RR15 pKa = 11.84HH16 pKa = 4.42GFRR19 pKa = 11.84ARR21 pKa = 11.84MATKK25 pKa = 10.23GGRR28 pKa = 11.84LVLSARR34 pKa = 11.84RR35 pKa = 11.84AKK37 pKa = 9.97GRR39 pKa = 11.84KK40 pKa = 8.91RR41 pKa = 11.84LSAA44 pKa = 3.96
MM1 pKa = 7.35KK2 pKa = 9.44RR3 pKa = 11.84TYY5 pKa = 10.31QPSNLVRR12 pKa = 11.84KK13 pKa = 9.18RR14 pKa = 11.84RR15 pKa = 11.84HH16 pKa = 4.42GFRR19 pKa = 11.84ARR21 pKa = 11.84MATKK25 pKa = 10.23GGRR28 pKa = 11.84LVLSARR34 pKa = 11.84RR35 pKa = 11.84AKK37 pKa = 9.97GRR39 pKa = 11.84KK40 pKa = 8.91RR41 pKa = 11.84LSAA44 pKa = 3.96
Molecular weight: 5.12 kDa
Isoelectric point according different methods:
Peptides (in silico digests for buttom-up proteomics)
Below you can find in silico digests of the whole proteome with Trypsin, Chymotrypsin, Trypsin+LysC, LysN, ArgC proteases suitable for different mass spec machines.| Try ESI |
 |
|---|
| ChTry ESI |
|
|---|
| ArgC ESI |
|
|---|
| LysN ESI |
|
|---|
| TryLysC ESI |
|
|---|
| Try MALDI |
|
|---|
| ChTry MALDI |
|
|---|
| ArgC MALDI |
|
|---|
| LysN MALDI |
|
|---|
| TryLysC MALDI |
|
|---|
| Try LTQ |
|
|---|
| ChTry LTQ |
|
|---|
| ArgC LTQ |
|
|---|
| LysN LTQ |
|
|---|
| TryLysC LTQ |
|
|---|
| Try MSlow |
|
|---|
| ChTry MSlow |
|
|---|
| ArgC MSlow |
|
|---|
| LysN MSlow |
|
|---|
| TryLysC MSlow |
|
|---|
| Try MShigh |
|
|---|
| ChTry MShigh |
|
|---|
| ArgC MShigh |
|
|---|
| LysN MShigh |
|
|---|
| TryLysC MShigh |
|
|---|
General Statistics
Number of major isoforms |
Number of additional isoforms |
Number of all proteins |
Number of amino acids |
Min. Seq. Length |
Max. Seq. Length |
Avg. Seq. Length |
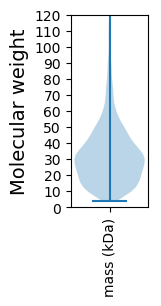
Avg. Mol. Weight |
|---|---|---|---|---|---|---|---|
0 |
1389744 |
38 |
2958 |
315.6 |
34.01 |
Amino acid frequency
Ala |
Cys |
Asp |
Glu |
Phe |
Gly |
His |
Ile |
Lys |
Leu |
|---|---|---|---|---|---|---|---|---|---|
13.699 ± 0.063 | 0.843 ± 0.01 |
5.676 ± 0.037 | 5.693 ± 0.033 |
3.576 ± 0.024 | 9.072 ± 0.046 |
2.031 ± 0.019 | 4.846 ± 0.032 |
2.66 ± 0.029 | 10.517 ± 0.053 |
Met |
Asn |
Gln |
Pro |
Arg |
Ser |
Thr |
Val |
Trp |
Tyr |
|---|---|---|---|---|---|---|---|---|---|
2.681 ± 0.02 | 2.239 ± 0.024 |
5.49 ± 0.034 | 2.927 ± 0.017 |
7.321 ± 0.047 | 4.643 ± 0.029 |
5.374 ± 0.03 | 7.281 ± 0.034 |
1.477 ± 0.018 | 1.956 ± 0.017 |
Most of the basic statistics you can see at this page can be downloaded from this CSV file
See this proteome in:

Proteome-pI is available under Creative Commons Attribution-NoDerivs license, for more details see here
| Reference: Kozlowski LP. Proteome-pI 2.0: Proteome Isoelectric Point Database Update. Nucleic Acids Res. 2021, doi: 10.1093/nar/gkab944 | Contact: Lukasz P. Kozlowski |