Magnetospirillum moscoviense
Taxonomy: cellular organisms; Bacteria; Proteobacteria; Alphaproteobacteria; Rhodospirillales; Rhodospirillaceae; Magnetospirillum
Average proteome isoelectric point is 6.53
Get precalculated fractions of proteins
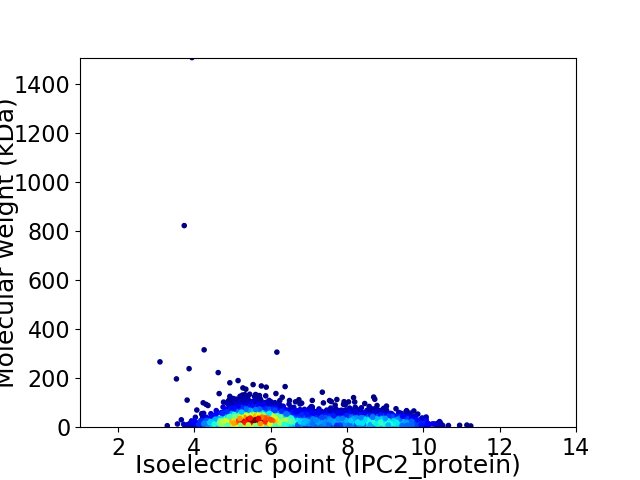
Virtual 2D-PAGE plot for 3747 proteins (isoelectric point calculated using IPC2_protein)
Get csv file with sequences according to given criteria:
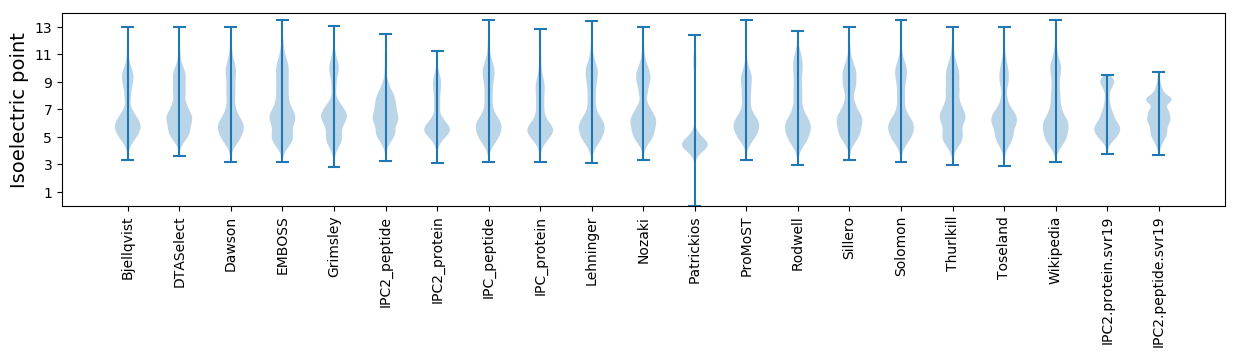
* You can choose from 21 different methods for calculating isoelectric point
Summary statistics related to proteome-wise predictions
Protein with the lowest isoelectric point:
>tr|A0A178MPG4|A0A178MPG4_9PROT Phosphopantetheine adenylyltransferase OS=Magnetospirillum moscoviense OX=1437059 GN=coaD PE=3 SV=1
MM1 pKa = 7.87AYY3 pKa = 10.3LSKK6 pKa = 10.67NLSVLSSANAFTMWHH21 pKa = 5.43YY22 pKa = 7.47TTTDD26 pKa = 2.81TAATVDD32 pKa = 3.4TEE34 pKa = 5.26GYY36 pKa = 9.58FNQASGMLRR45 pKa = 11.84VGDD48 pKa = 4.34FIVANVDD55 pKa = 3.15TDD57 pKa = 3.55GTPAHH62 pKa = 6.44GLFVVLSNAAGVVDD76 pKa = 4.27VGDD79 pKa = 3.86MVAVGGTDD87 pKa = 2.97TDD89 pKa = 3.51
MM1 pKa = 7.87AYY3 pKa = 10.3LSKK6 pKa = 10.67NLSVLSSANAFTMWHH21 pKa = 5.43YY22 pKa = 7.47TTTDD26 pKa = 2.81TAATVDD32 pKa = 3.4TEE34 pKa = 5.26GYY36 pKa = 9.58FNQASGMLRR45 pKa = 11.84VGDD48 pKa = 4.34FIVANVDD55 pKa = 3.15TDD57 pKa = 3.55GTPAHH62 pKa = 6.44GLFVVLSNAAGVVDD76 pKa = 4.27VGDD79 pKa = 3.86MVAVGGTDD87 pKa = 2.97TDD89 pKa = 3.51
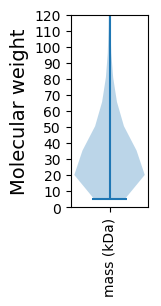
Molecular weight: 9.24 kDa
Isoelectric point according different methods:
Protein with the highest isoelectric point:
>tr|A0A178MGP8|A0A178MGP8_9PROT DUF218 domain-containing protein OS=Magnetospirillum moscoviense OX=1437059 GN=A6A05_03220 PE=4 SV=1
MM1 pKa = 7.45KK2 pKa = 9.59RR3 pKa = 11.84TFQPSKK9 pKa = 8.7IVRR12 pKa = 11.84ARR14 pKa = 11.84RR15 pKa = 11.84HH16 pKa = 4.66GFRR19 pKa = 11.84SRR21 pKa = 11.84MATVGGRR28 pKa = 11.84KK29 pKa = 9.32VIANRR34 pKa = 11.84RR35 pKa = 11.84SKK37 pKa = 10.46GRR39 pKa = 11.84KK40 pKa = 8.72RR41 pKa = 11.84LSAA44 pKa = 3.96
MM1 pKa = 7.45KK2 pKa = 9.59RR3 pKa = 11.84TFQPSKK9 pKa = 8.7IVRR12 pKa = 11.84ARR14 pKa = 11.84RR15 pKa = 11.84HH16 pKa = 4.66GFRR19 pKa = 11.84SRR21 pKa = 11.84MATVGGRR28 pKa = 11.84KK29 pKa = 9.32VIANRR34 pKa = 11.84RR35 pKa = 11.84SKK37 pKa = 10.46GRR39 pKa = 11.84KK40 pKa = 8.72RR41 pKa = 11.84LSAA44 pKa = 3.96
Molecular weight: 5.11 kDa
Isoelectric point according different methods:
Peptides (in silico digests for buttom-up proteomics)
Below you can find in silico digests of the whole proteome with Trypsin, Chymotrypsin, Trypsin+LysC, LysN, ArgC proteases suitable for different mass spec machines.| Try ESI |
 |
|---|
| ChTry ESI |
|
|---|
| ArgC ESI |
|
|---|
| LysN ESI |
|
|---|
| TryLysC ESI |
|
|---|
| Try MALDI |
|
|---|
| ChTry MALDI |
|
|---|
| ArgC MALDI |
|
|---|
| LysN MALDI |
|
|---|
| TryLysC MALDI |
|
|---|
| Try LTQ |
|
|---|
| ChTry LTQ |
|
|---|
| ArgC LTQ |
|
|---|
| LysN LTQ |
|
|---|
| TryLysC LTQ |
|
|---|
| Try MSlow |
|
|---|
| ChTry MSlow |
|
|---|
| ArgC MSlow |
|
|---|
| LysN MSlow |
|
|---|
| TryLysC MSlow |
|
|---|
| Try MShigh |
|
|---|
| ChTry MShigh |
|
|---|
| ArgC MShigh |
|
|---|
| LysN MShigh |
|
|---|
| TryLysC MShigh |
|
|---|
General Statistics
Number of major isoforms |
Number of additional isoforms |
Number of all proteins |
Number of amino acids |
Min. Seq. Length |
Max. Seq. Length |
Avg. Seq. Length |
Avg. Mol. Weight |
|---|---|---|---|---|---|---|---|
0 |
1212731 |
41 |
14963 |
323.7 |
35.02 |
Amino acid frequency
Ala |
Cys |
Asp |
Glu |
Phe |
Gly |
His |
Ile |
Lys |
Leu |
|---|---|---|---|---|---|---|---|---|---|
12.842 ± 0.069 | 0.963 ± 0.017 |
6.001 ± 0.036 | 5.507 ± 0.048 |
3.472 ± 0.024 | 8.611 ± 0.051 |
2.185 ± 0.026 | 4.849 ± 0.032 |
3.489 ± 0.042 | 10.373 ± 0.063 |
Met |
Asn |
Gln |
Pro |
Arg |
Ser |
Thr |
Val |
Trp |
Tyr |
|---|---|---|---|---|---|---|---|---|---|
2.572 ± 0.025 | 2.454 ± 0.043 |
5.126 ± 0.048 | 3.216 ± 0.023 |
6.945 ± 0.075 | 5.07 ± 0.057 |
5.229 ± 0.1 | 7.732 ± 0.032 |
1.367 ± 0.016 | 1.996 ± 0.02 |
Most of the basic statistics you can see at this page can be downloaded from this CSV file
See this proteome in:

Proteome-pI is available under Creative Commons Attribution-NoDerivs license, for more details see here
| Reference: Kozlowski LP. Proteome-pI 2.0: Proteome Isoelectric Point Database Update. Nucleic Acids Res. 2021, doi: 10.1093/nar/gkab944 | Contact: Lukasz P. Kozlowski |