Thermanaerothrix daxensis
Taxonomy: cellular organisms; Bacteria; Terrabacteria group; Chloroflexi; Anaerolineae; Anaerolineales; Anaerolineaceae; Thermanaerothrix
Average proteome isoelectric point is 6.54
Get precalculated fractions of proteins
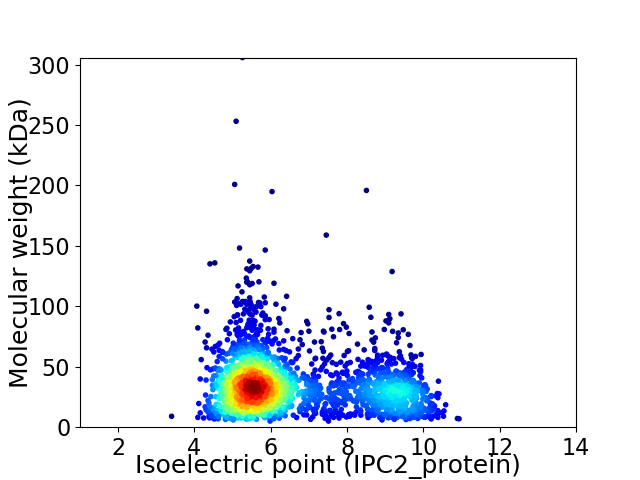
Virtual 2D-PAGE plot for 2394 proteins (isoelectric point calculated using IPC2_protein)
Get csv file with sequences according to given criteria:
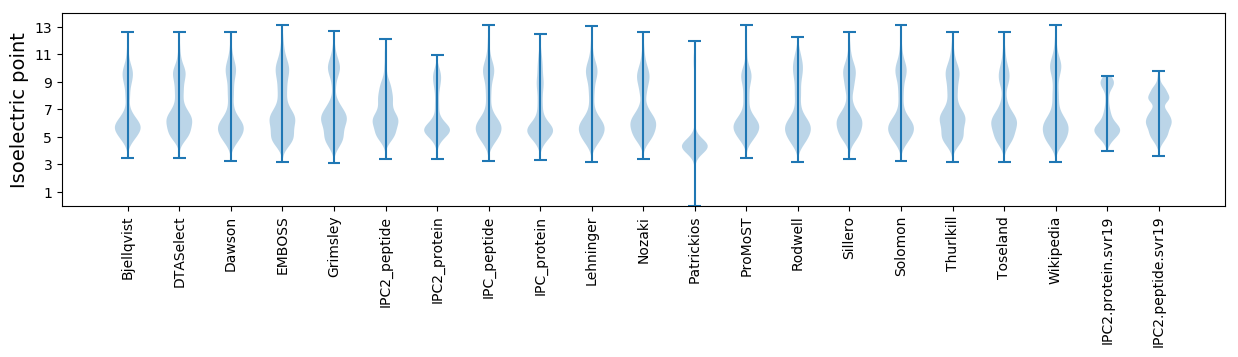
* You can choose from 21 different methods for calculating isoelectric point
Summary statistics related to proteome-wise predictions
Protein with the lowest isoelectric point:
>tr|A0A0P6XRZ9|A0A0P6XRZ9_9CHLR HTH gntR-type domain-containing protein OS=Thermanaerothrix daxensis OX=869279 GN=SE15_08085 PE=4 SV=1
MM1 pKa = 7.56TEE3 pKa = 4.39DD4 pKa = 4.11DD5 pKa = 4.05DD6 pKa = 4.68RR7 pKa = 11.84GYY9 pKa = 10.24MLDD12 pKa = 4.92VFICQQGNLIWWPVALSDD30 pKa = 4.82QYY32 pKa = 9.39QTSYY36 pKa = 10.68TFTDD40 pKa = 3.9EE41 pKa = 4.83PGCSQPSGGVLYY53 pKa = 9.88TVEE56 pKa = 3.91KK57 pKa = 10.14HH58 pKa = 6.21GYY60 pKa = 7.55SHH62 pKa = 7.26PTPIPWPSPP71 pKa = 3.3
MM1 pKa = 7.56TEE3 pKa = 4.39DD4 pKa = 4.11DD5 pKa = 4.05DD6 pKa = 4.68RR7 pKa = 11.84GYY9 pKa = 10.24MLDD12 pKa = 4.92VFICQQGNLIWWPVALSDD30 pKa = 4.82QYY32 pKa = 9.39QTSYY36 pKa = 10.68TFTDD40 pKa = 3.9EE41 pKa = 4.83PGCSQPSGGVLYY53 pKa = 9.88TVEE56 pKa = 3.91KK57 pKa = 10.14HH58 pKa = 6.21GYY60 pKa = 7.55SHH62 pKa = 7.26PTPIPWPSPP71 pKa = 3.3
Molecular weight: 8.05 kDa
Isoelectric point according different methods:
Protein with the highest isoelectric point:
>tr|A0A0P6XK15|A0A0P6XK15_9CHLR Ribose import ATP-binding protein RbsA OS=Thermanaerothrix daxensis OX=869279 GN=rbsA PE=3 SV=1
MM1 pKa = 7.83LSPKK5 pKa = 10.19LRR7 pKa = 11.84TAFALSLLLMGVIPILPPLMLALVKK32 pKa = 10.3RR33 pKa = 11.84LRR35 pKa = 11.84RR36 pKa = 11.84PRR38 pKa = 11.84VRR40 pKa = 11.84VSEE43 pKa = 3.97ATALGRR49 pKa = 11.84RR50 pKa = 11.84GTALLLGPRR59 pKa = 11.84QGRR62 pKa = 11.84SVGRR66 pKa = 3.69
MM1 pKa = 7.83LSPKK5 pKa = 10.19LRR7 pKa = 11.84TAFALSLLLMGVIPILPPLMLALVKK32 pKa = 10.3RR33 pKa = 11.84LRR35 pKa = 11.84RR36 pKa = 11.84PRR38 pKa = 11.84VRR40 pKa = 11.84VSEE43 pKa = 3.97ATALGRR49 pKa = 11.84RR50 pKa = 11.84GTALLLGPRR59 pKa = 11.84QGRR62 pKa = 11.84SVGRR66 pKa = 3.69
Molecular weight: 7.21 kDa
Isoelectric point according different methods:
Peptides (in silico digests for buttom-up proteomics)
Below you can find in silico digests of the whole proteome with Trypsin, Chymotrypsin, Trypsin+LysC, LysN, ArgC proteases suitable for different mass spec machines.| Try ESI |
 |
|---|
| ChTry ESI |
|
|---|
| ArgC ESI |
|
|---|
| LysN ESI |
|
|---|
| TryLysC ESI |
|
|---|
| Try MALDI |
|
|---|
| ChTry MALDI |
|
|---|
| ArgC MALDI |
|
|---|
| LysN MALDI |
|
|---|
| TryLysC MALDI |
|
|---|
| Try LTQ |
|
|---|
| ChTry LTQ |
|
|---|
| ArgC LTQ |
|
|---|
| LysN LTQ |
|
|---|
| TryLysC LTQ |
|
|---|
| Try MSlow |
|
|---|
| ChTry MSlow |
|
|---|
| ArgC MSlow |
|
|---|
| LysN MSlow |
|
|---|
| TryLysC MSlow |
|
|---|
| Try MShigh |
|
|---|
| ChTry MShigh |
|
|---|
| ArgC MShigh |
|
|---|
| LysN MShigh |
|
|---|
| TryLysC MShigh |
|
|---|
General Statistics
Number of major isoforms |
Number of additional isoforms |
Number of all proteins |
Number of amino acids |
Min. Seq. Length |
Max. Seq. Length |
Avg. Seq. Length |
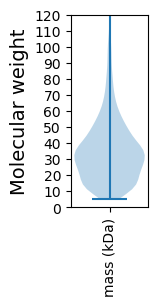
Avg. Mol. Weight |
|---|---|---|---|---|---|---|---|
0 |
786151 |
48 |
2810 |
328.4 |
36.38 |
Amino acid frequency
Ala |
Cys |
Asp |
Glu |
Phe |
Gly |
His |
Ile |
Lys |
Leu |
|---|---|---|---|---|---|---|---|---|---|
10.072 ± 0.057 | 0.788 ± 0.015 |
4.296 ± 0.034 | 6.487 ± 0.058 |
3.69 ± 0.035 | 7.737 ± 0.052 |
2.149 ± 0.023 | 5.586 ± 0.045 |
2.713 ± 0.037 | 12.18 ± 0.075 |
Met |
Asn |
Gln |
Pro |
Arg |
Ser |
Thr |
Val |
Trp |
Tyr |
|---|---|---|---|---|---|---|---|---|---|
2.18 ± 0.021 | 2.724 ± 0.025 |
5.867 ± 0.042 | 4.13 ± 0.039 |
7.127 ± 0.044 | 4.779 ± 0.034 |
5.244 ± 0.037 | 7.597 ± 0.046 |
1.731 ± 0.029 | 2.922 ± 0.031 |
Most of the basic statistics you can see at this page can be downloaded from this CSV file
See this proteome in:

Proteome-pI is available under Creative Commons Attribution-NoDerivs license, for more details see here
| Reference: Kozlowski LP. Proteome-pI 2.0: Proteome Isoelectric Point Database Update. Nucleic Acids Res. 2021, doi: 10.1093/nar/gkab944 | Contact: Lukasz P. Kozlowski |