Plasmodium yoelii yoelii
Taxonomy: cellular organisms; Eukaryota; Sar; Alveolata; Apicomplexa; Aconoidasida; Haemosporida; Plasmodiidae; Plasmodium; Plasmodium (Vinckeia); Plasmodium yoelii
Average proteome isoelectric point is 7.26
Get precalculated fractions of proteins
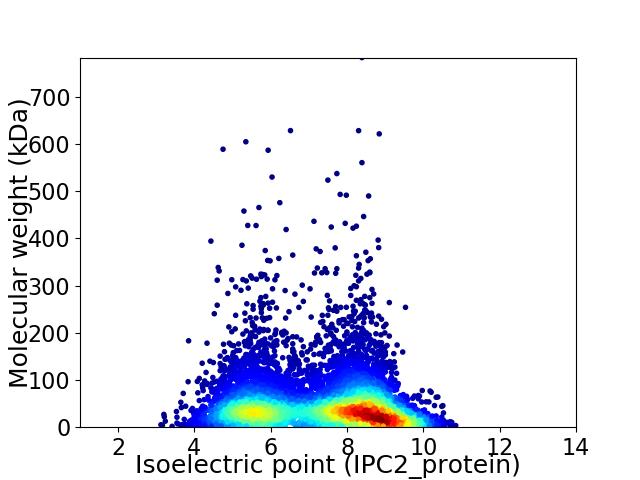
Virtual 2D-PAGE plot for 7741 proteins (isoelectric point calculated using IPC2_protein)
Get csv file with sequences according to given criteria:
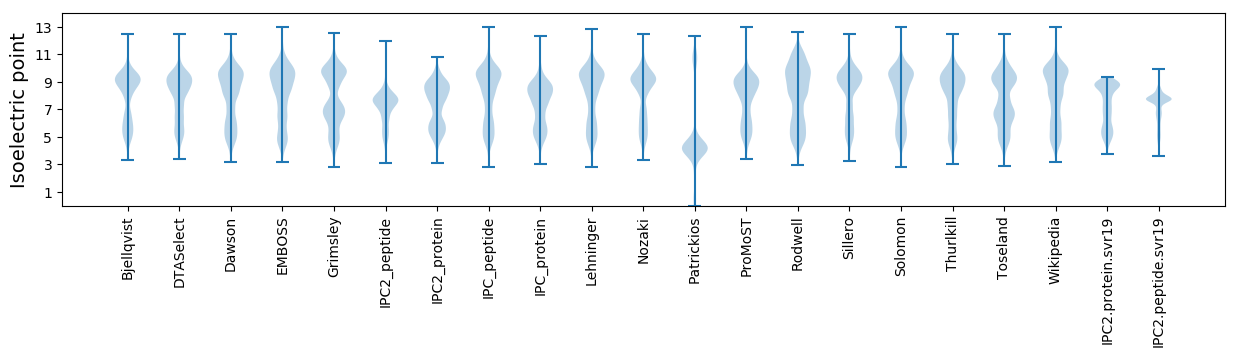
* You can choose from 21 different methods for calculating isoelectric point
Summary statistics related to proteome-wise predictions
Protein with the lowest isoelectric point:
>tr|Q7RHP3|Q7RHP3_PLAYO GAF domain protein OS=Plasmodium yoelii yoelii OX=73239 GN=PY03941 PE=4 SV=1
MM1 pKa = 8.31DD2 pKa = 4.66DD3 pKa = 3.95TEE5 pKa = 5.24GLAPGNMNDD14 pKa = 4.75AEE16 pKa = 4.66GLAPDD21 pKa = 4.95NMDD24 pKa = 3.8DD25 pKa = 4.35TEE27 pKa = 4.89GLAPGNMDD35 pKa = 3.25DD36 pKa = 4.65TEE38 pKa = 4.62HH39 pKa = 5.4NHH41 pKa = 4.09YY42 pKa = 10.22RR43 pKa = 11.84YY44 pKa = 10.74YY45 pKa = 10.27IDD47 pKa = 4.13IRR49 pKa = 11.84LIHH52 pKa = 5.89YY53 pKa = 8.55
MM1 pKa = 8.31DD2 pKa = 4.66DD3 pKa = 3.95TEE5 pKa = 5.24GLAPGNMNDD14 pKa = 4.75AEE16 pKa = 4.66GLAPDD21 pKa = 4.95NMDD24 pKa = 3.8DD25 pKa = 4.35TEE27 pKa = 4.89GLAPGNMDD35 pKa = 3.25DD36 pKa = 4.65TEE38 pKa = 4.62HH39 pKa = 5.4NHH41 pKa = 4.09YY42 pKa = 10.22RR43 pKa = 11.84YY44 pKa = 10.74YY45 pKa = 10.27IDD47 pKa = 4.13IRR49 pKa = 11.84LIHH52 pKa = 5.89YY53 pKa = 8.55
Molecular weight: 6.0 kDa
Isoelectric point according different methods:
Protein with the highest isoelectric point:
>tr|Q7RAX0|Q7RAX0_PLAYO N-acetylglucosaminylphosphatidylinositol deacetylase (Fragment) OS=Plasmodium yoelii yoelii OX=73239 GN=PY06379 PE=3 SV=1
SS1 pKa = 6.69SRR3 pKa = 11.84FIPRR7 pKa = 11.84FTRR10 pKa = 11.84RR11 pKa = 11.84IKK13 pKa = 10.6KK14 pKa = 10.15NKK16 pKa = 9.12
SS1 pKa = 6.69SRR3 pKa = 11.84FIPRR7 pKa = 11.84FTRR10 pKa = 11.84RR11 pKa = 11.84IKK13 pKa = 10.6KK14 pKa = 10.15NKK16 pKa = 9.12
Molecular weight: 2.03 kDa
Isoelectric point according different methods:
Peptides (in silico digests for buttom-up proteomics)
Below you can find in silico digests of the whole proteome with Trypsin, Chymotrypsin, Trypsin+LysC, LysN, ArgC proteases suitable for different mass spec machines.| Try ESI |
 |
|---|
| ChTry ESI |
|
|---|
| ArgC ESI |
|
|---|
| LysN ESI |
|
|---|
| TryLysC ESI |
|
|---|
| Try MALDI |
|
|---|
| ChTry MALDI |
|
|---|
| ArgC MALDI |
|
|---|
| LysN MALDI |
|
|---|
| TryLysC MALDI |
|
|---|
| Try LTQ |
|
|---|
| ChTry LTQ |
|
|---|
| ArgC LTQ |
|
|---|
| LysN LTQ |
|
|---|
| TryLysC LTQ |
|
|---|
| Try MSlow |
|
|---|
| ChTry MSlow |
|
|---|
| ArgC MSlow |
|
|---|
| LysN MSlow |
|
|---|
| TryLysC MSlow |
|
|---|
| Try MShigh |
|
|---|
| ChTry MShigh |
|
|---|
| ArgC MShigh |
|
|---|
| LysN MShigh |
|
|---|
| TryLysC MShigh |
|
|---|
General Statistics
Number of major isoforms |
Number of additional isoforms |
Number of all proteins |
Number of amino acids |
Min. Seq. Length |
Max. Seq. Length |
Avg. Seq. Length |
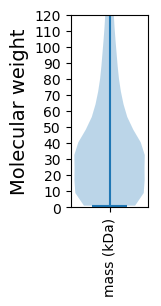
Avg. Mol. Weight |
|---|---|---|---|---|---|---|---|
0 |
3378133 |
8 |
6636 |
436.4 |
51.01 |
Amino acid frequency
Ala |
Cys |
Asp |
Glu |
Phe |
Gly |
His |
Ile |
Lys |
Leu |
|---|---|---|---|---|---|---|---|---|---|
2.514 ± 0.025 | 1.745 ± 0.013 |
5.929 ± 0.023 | 7.104 ± 0.04 |
4.785 ± 0.027 | 3.375 ± 0.027 |
1.93 ± 0.009 | 9.646 ± 0.031 |
11.509 ± 0.04 | 7.873 ± 0.033 |
Met |
Asn |
Gln |
Pro |
Arg |
Ser |
Thr |
Val |
Trp |
Tyr |
|---|---|---|---|---|---|---|---|---|---|
1.909 ± 0.01 | 12.799 ± 0.072 |
2.276 ± 0.021 | 2.797 ± 0.029 |
2.655 ± 0.021 | 7.201 ± 0.026 |
4.298 ± 0.017 | 3.717 ± 0.021 |
0.521 ± 0.007 | 5.366 ± 0.025 |
Most of the basic statistics you can see at this page can be downloaded from this CSV file
See this proteome in:

Proteome-pI is available under Creative Commons Attribution-NoDerivs license, for more details see here
| Reference: Kozlowski LP. Proteome-pI 2.0: Proteome Isoelectric Point Database Update. Nucleic Acids Res. 2021, doi: 10.1093/nar/gkab944 | Contact: Lukasz P. Kozlowski |