Mycobacterium phage SiSi
Taxonomy: Viruses; Duplodnaviria; Heunggongvirae; Uroviricota; Caudoviricetes; Caudovirales; Siphoviridae; Cheoctovirus; unclassified Cheoctovirus
Average proteome isoelectric point is 5.96
Get precalculated fractions of proteins
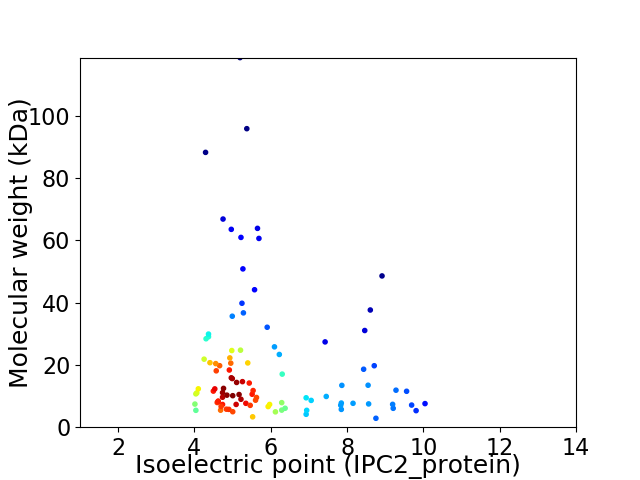
Virtual 2D-PAGE plot for 99 proteins (isoelectric point calculated using IPC2_protein)
Get csv file with sequences according to given criteria:
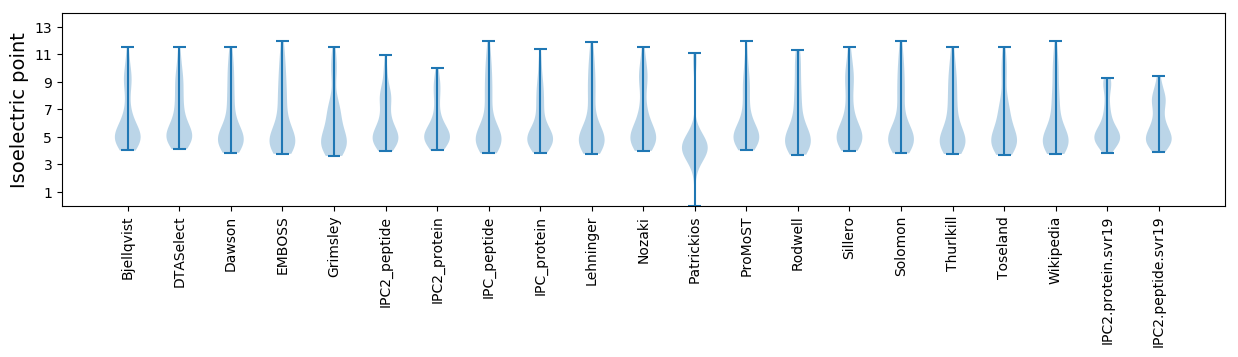
* You can choose from 21 different methods for calculating isoelectric point
Summary statistics related to proteome-wise predictions
Protein with the lowest isoelectric point:
>tr|R4JH80|R4JH80_9CAUD Uncharacterized protein OS=Mycobacterium phage SiSi OX=1327777 GN=78 PE=4 SV=1
MM1 pKa = 7.01THH3 pKa = 6.73HH4 pKa = 7.63PDD6 pKa = 3.69EE7 pKa = 5.31IDD9 pKa = 4.62PISQLEE15 pKa = 4.03LDD17 pKa = 3.73ILANSGDD24 pKa = 4.19LDD26 pKa = 4.2LATKK30 pKa = 10.37AGEE33 pKa = 4.25VAQWAYY39 pKa = 9.17VQSVEE44 pKa = 4.44ALCALLCLPPEE55 pKa = 4.39VAEE58 pKa = 4.0QMVNEE63 pKa = 4.5WFLKK67 pKa = 10.29
MM1 pKa = 7.01THH3 pKa = 6.73HH4 pKa = 7.63PDD6 pKa = 3.69EE7 pKa = 5.31IDD9 pKa = 4.62PISQLEE15 pKa = 4.03LDD17 pKa = 3.73ILANSGDD24 pKa = 4.19LDD26 pKa = 4.2LATKK30 pKa = 10.37AGEE33 pKa = 4.25VAQWAYY39 pKa = 9.17VQSVEE44 pKa = 4.44ALCALLCLPPEE55 pKa = 4.39VAEE58 pKa = 4.0QMVNEE63 pKa = 4.5WFLKK67 pKa = 10.29
Molecular weight: 7.42 kDa
Isoelectric point according different methods:
Protein with the highest isoelectric point:
>tr|R4JFR7|R4JFR7_9CAUD Holin OS=Mycobacterium phage SiSi OX=1327777 GN=32 PE=4 SV=1
MM1 pKa = 7.7KK2 pKa = 10.18IHH4 pKa = 5.44VQSRR8 pKa = 11.84GPAGWNATVLFTAGTVYY25 pKa = 10.11TVADD29 pKa = 3.79DD30 pKa = 3.38QGRR33 pKa = 11.84KK34 pKa = 9.22HH35 pKa = 6.73LIDD38 pKa = 3.4TSRR41 pKa = 11.84VTVRR45 pKa = 11.84RR46 pKa = 11.84LSS48 pKa = 3.31
MM1 pKa = 7.7KK2 pKa = 10.18IHH4 pKa = 5.44VQSRR8 pKa = 11.84GPAGWNATVLFTAGTVYY25 pKa = 10.11TVADD29 pKa = 3.79DD30 pKa = 3.38QGRR33 pKa = 11.84KK34 pKa = 9.22HH35 pKa = 6.73LIDD38 pKa = 3.4TSRR41 pKa = 11.84VTVRR45 pKa = 11.84RR46 pKa = 11.84LSS48 pKa = 3.31
Molecular weight: 5.31 kDa
Isoelectric point according different methods:
Peptides (in silico digests for buttom-up proteomics)
Below you can find in silico digests of the whole proteome with Trypsin, Chymotrypsin, Trypsin+LysC, LysN, ArgC proteases suitable for different mass spec machines.| Try ESI |
 |
|---|
| ChTry ESI |
|
|---|
| ArgC ESI |
|
|---|
| LysN ESI |
|
|---|
| TryLysC ESI |
|
|---|
| Try MALDI |
|
|---|
| ChTry MALDI |
|
|---|
| ArgC MALDI |
|
|---|
| LysN MALDI |
|
|---|
| TryLysC MALDI |
|
|---|
| Try LTQ |
|
|---|
| ChTry LTQ |
|
|---|
| ArgC LTQ |
|
|---|
| LysN LTQ |
|
|---|
| TryLysC LTQ |
|
|---|
| Try MSlow |
|
|---|
| ChTry MSlow |
|
|---|
| ArgC MSlow |
|
|---|
| LysN MSlow |
|
|---|
| TryLysC MSlow |
|
|---|
| Try MShigh |
|
|---|
| ChTry MShigh |
|
|---|
| ArgC MShigh |
|
|---|
| LysN MShigh |
|
|---|
| TryLysC MShigh |
|
|---|
General Statistics
Number of major isoforms |
Number of additional isoforms |
Number of all proteins |
Number of amino acids |
Min. Seq. Length |
Max. Seq. Length |
Avg. Seq. Length |
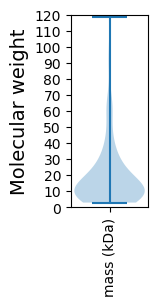
Avg. Mol. Weight |
|---|---|---|---|---|---|---|---|
0 |
17977 |
25 |
1160 |
181.6 |
19.88 |
Amino acid frequency
Ala |
Cys |
Asp |
Glu |
Phe |
Gly |
His |
Ile |
Lys |
Leu |
|---|---|---|---|---|---|---|---|---|---|
10.558 ± 0.456 | 1.274 ± 0.18 |
6.714 ± 0.217 | 5.952 ± 0.343 |
3.043 ± 0.208 | 8.795 ± 0.582 |
2.309 ± 0.208 | 4.35 ± 0.181 |
3.382 ± 0.195 | 7.326 ± 0.247 |
Met |
Asn |
Gln |
Pro |
Arg |
Ser |
Thr |
Val |
Trp |
Tyr |
|---|---|---|---|---|---|---|---|---|---|
2.292 ± 0.117 | 3.377 ± 0.197 |
6.113 ± 0.208 | 3.382 ± 0.194 |
6.825 ± 0.387 | 5.763 ± 0.289 |
6.692 ± 0.233 | 7.048 ± 0.297 |
2.309 ± 0.153 | 2.498 ± 0.136 |
Most of the basic statistics you can see at this page can be downloaded from this CSV file
See this proteome in:

Proteome-pI is available under Creative Commons Attribution-NoDerivs license, for more details see here
| Reference: Kozlowski LP. Proteome-pI 2.0: Proteome Isoelectric Point Database Update. Nucleic Acids Res. 2021, doi: 10.1093/nar/gkab944 | Contact: Lukasz P. Kozlowski |