Roseivivax jejudonensis
Taxonomy: cellular organisms; Bacteria; Proteobacteria; Alphaproteobacteria; Rhodobacterales; Roseobacteraceae; Roseivivax
Average proteome isoelectric point is 6.08
Get precalculated fractions of proteins
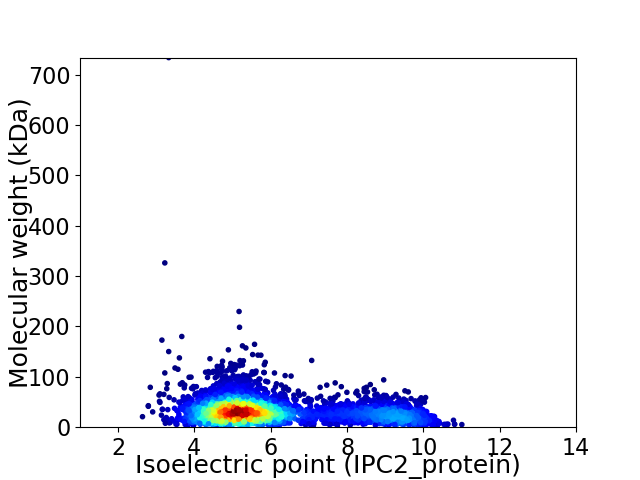
Virtual 2D-PAGE plot for 4082 proteins (isoelectric point calculated using IPC2_protein)
Get csv file with sequences according to given criteria:
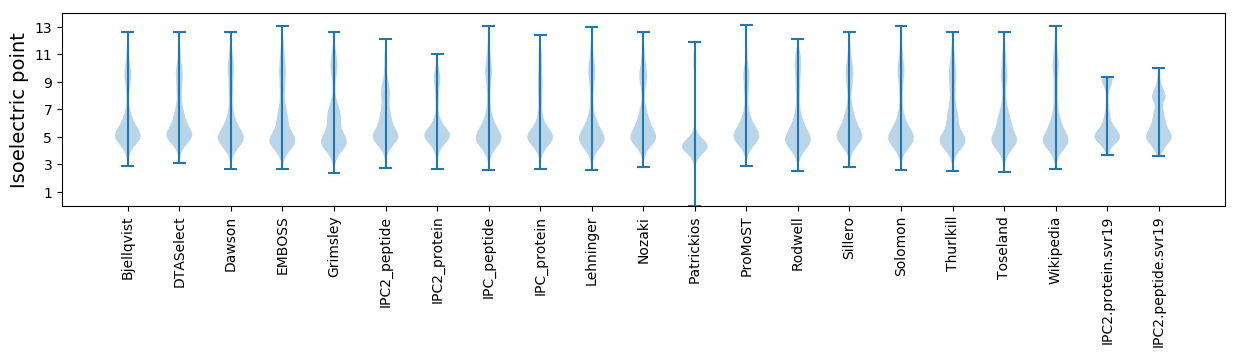
* You can choose from 21 different methods for calculating isoelectric point
Summary statistics related to proteome-wise predictions
Protein with the lowest isoelectric point:
>tr|A0A1X6ZXI2|A0A1X6ZXI2_9RHOB Carboxymethylenebutenolidase OS=Roseivivax jejudonensis OX=1529041 GN=clcD_1 PE=4 SV=1
MM1 pKa = 7.35HH2 pKa = 6.87RR3 pKa = 11.84TAALALVTAALAGPALAQDD22 pKa = 3.81ADD24 pKa = 3.92EE25 pKa = 4.83SVSGTLVLYY34 pKa = 9.02TSQPDD39 pKa = 2.99QDD41 pKa = 3.7AQQTVDD47 pKa = 4.3AFNEE51 pKa = 4.28VYY53 pKa = 10.54PDD55 pKa = 3.65VDD57 pKa = 3.98VEE59 pKa = 4.22WVRR62 pKa = 11.84DD63 pKa = 3.59GTTQMMARR71 pKa = 11.84LRR73 pKa = 11.84AEE75 pKa = 4.42FEE77 pKa = 4.19AGQPQPDD84 pKa = 3.71VLLIADD90 pKa = 4.56TVTMEE95 pKa = 3.87SLEE98 pKa = 4.11RR99 pKa = 11.84DD100 pKa = 4.15GRR102 pKa = 11.84LMAYY106 pKa = 9.62PDD108 pKa = 4.55ADD110 pKa = 3.18VSAYY114 pKa = 10.49DD115 pKa = 4.59DD116 pKa = 4.02GLMDD120 pKa = 3.86PEE122 pKa = 5.16GYY124 pKa = 10.53YY125 pKa = 10.8FSTKK129 pKa = 10.53LITTGIVYY137 pKa = 10.59NEE139 pKa = 4.11AAEE142 pKa = 4.21MVPEE146 pKa = 4.72SYY148 pKa = 11.54ADD150 pKa = 3.86LLEE153 pKa = 4.45PAAEE157 pKa = 4.21NNIVMPSPLEE167 pKa = 4.14SGAATIHH174 pKa = 5.55MVSLTGLPDD183 pKa = 4.26LGWDD187 pKa = 3.75YY188 pKa = 11.98YY189 pKa = 11.18EE190 pKa = 4.99GLAEE194 pKa = 4.34QGAIAQGGNGGTYY207 pKa = 9.3QAVAGGQALYY217 pKa = 10.97GFVVDD222 pKa = 7.14FLALRR227 pKa = 11.84NIQDD231 pKa = 3.68GAPVGFVFPEE241 pKa = 4.09EE242 pKa = 4.17GVSAVTEE249 pKa = 3.97PVAILEE255 pKa = 4.3TAQNVEE261 pKa = 3.76AAQAFVDD268 pKa = 4.77FLLSEE273 pKa = 4.22QGQEE277 pKa = 3.43LAARR281 pKa = 11.84QGYY284 pKa = 9.37LPAHH288 pKa = 7.28PDD290 pKa = 3.08VAAPDD295 pKa = 3.95YY296 pKa = 10.86FPDD299 pKa = 3.48RR300 pKa = 11.84SGIEE304 pKa = 4.16VITFDD309 pKa = 4.9PAEE312 pKa = 4.19ALANDD317 pKa = 4.2AEE319 pKa = 4.44NKK321 pKa = 9.7EE322 pKa = 4.23RR323 pKa = 11.84FAEE326 pKa = 4.35TFGGG330 pKa = 3.75
MM1 pKa = 7.35HH2 pKa = 6.87RR3 pKa = 11.84TAALALVTAALAGPALAQDD22 pKa = 3.81ADD24 pKa = 3.92EE25 pKa = 4.83SVSGTLVLYY34 pKa = 9.02TSQPDD39 pKa = 2.99QDD41 pKa = 3.7AQQTVDD47 pKa = 4.3AFNEE51 pKa = 4.28VYY53 pKa = 10.54PDD55 pKa = 3.65VDD57 pKa = 3.98VEE59 pKa = 4.22WVRR62 pKa = 11.84DD63 pKa = 3.59GTTQMMARR71 pKa = 11.84LRR73 pKa = 11.84AEE75 pKa = 4.42FEE77 pKa = 4.19AGQPQPDD84 pKa = 3.71VLLIADD90 pKa = 4.56TVTMEE95 pKa = 3.87SLEE98 pKa = 4.11RR99 pKa = 11.84DD100 pKa = 4.15GRR102 pKa = 11.84LMAYY106 pKa = 9.62PDD108 pKa = 4.55ADD110 pKa = 3.18VSAYY114 pKa = 10.49DD115 pKa = 4.59DD116 pKa = 4.02GLMDD120 pKa = 3.86PEE122 pKa = 5.16GYY124 pKa = 10.53YY125 pKa = 10.8FSTKK129 pKa = 10.53LITTGIVYY137 pKa = 10.59NEE139 pKa = 4.11AAEE142 pKa = 4.21MVPEE146 pKa = 4.72SYY148 pKa = 11.54ADD150 pKa = 3.86LLEE153 pKa = 4.45PAAEE157 pKa = 4.21NNIVMPSPLEE167 pKa = 4.14SGAATIHH174 pKa = 5.55MVSLTGLPDD183 pKa = 4.26LGWDD187 pKa = 3.75YY188 pKa = 11.98YY189 pKa = 11.18EE190 pKa = 4.99GLAEE194 pKa = 4.34QGAIAQGGNGGTYY207 pKa = 9.3QAVAGGQALYY217 pKa = 10.97GFVVDD222 pKa = 7.14FLALRR227 pKa = 11.84NIQDD231 pKa = 3.68GAPVGFVFPEE241 pKa = 4.09EE242 pKa = 4.17GVSAVTEE249 pKa = 3.97PVAILEE255 pKa = 4.3TAQNVEE261 pKa = 3.76AAQAFVDD268 pKa = 4.77FLLSEE273 pKa = 4.22QGQEE277 pKa = 3.43LAARR281 pKa = 11.84QGYY284 pKa = 9.37LPAHH288 pKa = 7.28PDD290 pKa = 3.08VAAPDD295 pKa = 3.95YY296 pKa = 10.86FPDD299 pKa = 3.48RR300 pKa = 11.84SGIEE304 pKa = 4.16VITFDD309 pKa = 4.9PAEE312 pKa = 4.19ALANDD317 pKa = 4.2AEE319 pKa = 4.44NKK321 pKa = 9.7EE322 pKa = 4.23RR323 pKa = 11.84FAEE326 pKa = 4.35TFGGG330 pKa = 3.75
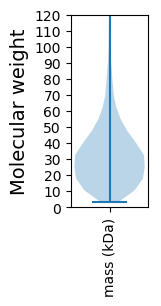
Molecular weight: 35.22 kDa
Isoelectric point according different methods:
Protein with the highest isoelectric point:
>tr|A0A1X6YBL8|A0A1X6YBL8_9RHOB Urease accessory protein UreE OS=Roseivivax jejudonensis OX=1529041 GN=ureE1 PE=3 SV=1
MM1 pKa = 7.26IRR3 pKa = 11.84SLVLPLGILAAPAAAHH19 pKa = 6.65PGAHH23 pKa = 6.34PHH25 pKa = 5.98PHH27 pKa = 6.19VATPWLAAALALVAVAALVALRR49 pKa = 11.84QSRR52 pKa = 11.84RR53 pKa = 11.84PRR55 pKa = 3.62
MM1 pKa = 7.26IRR3 pKa = 11.84SLVLPLGILAAPAAAHH19 pKa = 6.65PGAHH23 pKa = 6.34PHH25 pKa = 5.98PHH27 pKa = 6.19VATPWLAAALALVAVAALVALRR49 pKa = 11.84QSRR52 pKa = 11.84RR53 pKa = 11.84PRR55 pKa = 3.62
Molecular weight: 5.67 kDa
Isoelectric point according different methods:
Peptides (in silico digests for buttom-up proteomics)
Below you can find in silico digests of the whole proteome with Trypsin, Chymotrypsin, Trypsin+LysC, LysN, ArgC proteases suitable for different mass spec machines.| Try ESI |
 |
|---|
| ChTry ESI |
|
|---|
| ArgC ESI |
|
|---|
| LysN ESI |
|
|---|
| TryLysC ESI |
|
|---|
| Try MALDI |
|
|---|
| ChTry MALDI |
|
|---|
| ArgC MALDI |
|
|---|
| LysN MALDI |
|
|---|
| TryLysC MALDI |
|
|---|
| Try LTQ |
|
|---|
| ChTry LTQ |
|
|---|
| ArgC LTQ |
|
|---|
| LysN LTQ |
|
|---|
| TryLysC LTQ |
|
|---|
| Try MSlow |
|
|---|
| ChTry MSlow |
|
|---|
| ArgC MSlow |
|
|---|
| LysN MSlow |
|
|---|
| TryLysC MSlow |
|
|---|
| Try MShigh |
|
|---|
| ChTry MShigh |
|
|---|
| ArgC MShigh |
|
|---|
| LysN MShigh |
|
|---|
| TryLysC MShigh |
|
|---|
General Statistics
Number of major isoforms |
Number of additional isoforms |
Number of all proteins |
Number of amino acids |
Min. Seq. Length |
Max. Seq. Length |
Avg. Seq. Length |
Avg. Mol. Weight |
|---|---|---|---|---|---|---|---|
0 |
1278265 |
29 |
7162 |
313.1 |
33.8 |
Amino acid frequency
Ala |
Cys |
Asp |
Glu |
Phe |
Gly |
His |
Ile |
Lys |
Leu |
|---|---|---|---|---|---|---|---|---|---|
13.415 ± 0.073 | 0.838 ± 0.013 |
6.543 ± 0.057 | 6.107 ± 0.039 |
3.553 ± 0.024 | 9.041 ± 0.052 |
1.988 ± 0.022 | 4.686 ± 0.029 |
2.231 ± 0.031 | 9.887 ± 0.059 |
Met |
Asn |
Gln |
Pro |
Arg |
Ser |
Thr |
Val |
Trp |
Tyr |
|---|---|---|---|---|---|---|---|---|---|
2.542 ± 0.022 | 2.16 ± 0.028 |
5.32 ± 0.032 | 2.726 ± 0.02 |
7.594 ± 0.052 | 4.882 ± 0.025 |
5.544 ± 0.04 | 7.44 ± 0.031 |
1.408 ± 0.018 | 2.094 ± 0.019 |
Most of the basic statistics you can see at this page can be downloaded from this CSV file
See this proteome in:

Proteome-pI is available under Creative Commons Attribution-NoDerivs license, for more details see here
| Reference: Kozlowski LP. Proteome-pI 2.0: Proteome Isoelectric Point Database Update. Nucleic Acids Res. 2021, doi: 10.1093/nar/gkab944 | Contact: Lukasz P. Kozlowski |