Niabella soli DSM 19437
Taxonomy: cellular organisms; Bacteria; FCB group; Bacteroidetes/Chlorobi group; Bacteroidetes; Chitinophagia; Chitinophagales; Chitinophagaceae; Niabella; Niabella soli
Average proteome isoelectric point is 7.28
Get precalculated fractions of proteins
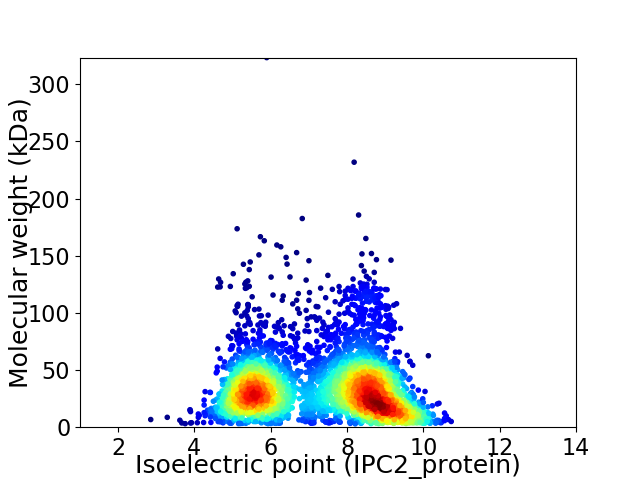
Virtual 2D-PAGE plot for 4110 proteins (isoelectric point calculated using IPC2_protein)
Get csv file with sequences according to given criteria:
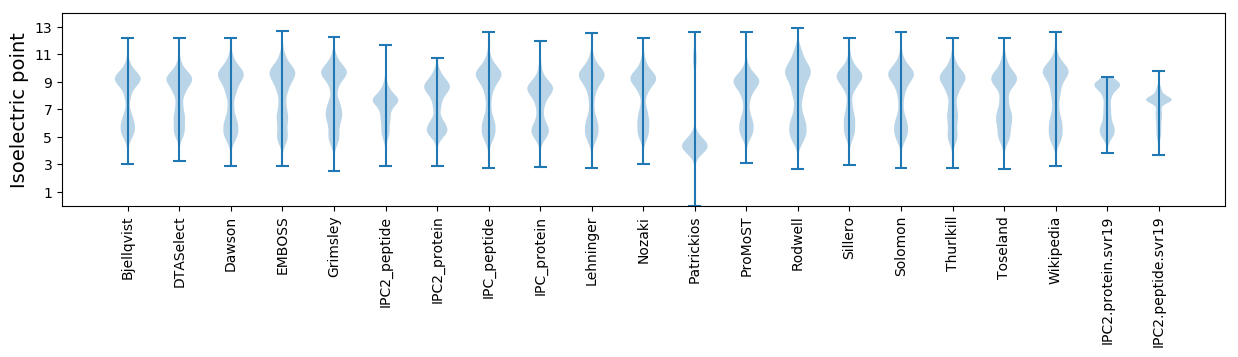
* You can choose from 21 different methods for calculating isoelectric point
Summary statistics related to proteome-wise predictions
Protein with the lowest isoelectric point:
>tr|W0F6P7|W0F6P7_9BACT Uncharacterized protein OS=Niabella soli DSM 19437 OX=929713 GN=NIASO_08850 PE=4 SV=1
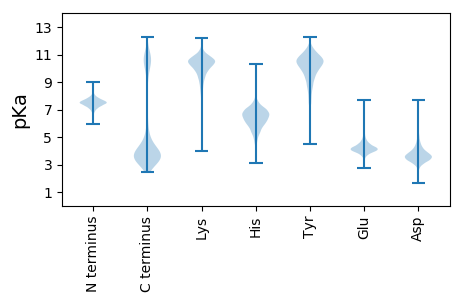
MM1 pKa = 8.03DD2 pKa = 4.29IEE4 pKa = 5.21LYY6 pKa = 8.82VHH8 pKa = 6.93AVFVCSDD15 pKa = 3.25AGNNDD20 pKa = 3.44ILPSAAAGSGLPEE33 pKa = 5.27DD34 pKa = 5.2DD35 pKa = 4.92GDD37 pKa = 4.71IEE39 pKa = 4.29EE40 pKa = 4.04QSIRR44 pKa = 11.84CSPTSPQPSPLNQPP58 pKa = 3.43
MM1 pKa = 8.03DD2 pKa = 4.29IEE4 pKa = 5.21LYY6 pKa = 8.82VHH8 pKa = 6.93AVFVCSDD15 pKa = 3.25AGNNDD20 pKa = 3.44ILPSAAAGSGLPEE33 pKa = 5.27DD34 pKa = 5.2DD35 pKa = 4.92GDD37 pKa = 4.71IEE39 pKa = 4.29EE40 pKa = 4.04QSIRR44 pKa = 11.84CSPTSPQPSPLNQPP58 pKa = 3.43
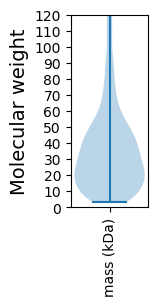
Molecular weight: 6.07 kDa
Isoelectric point according different methods:
Protein with the highest isoelectric point:
>tr|W0F8Y2|W0F8Y2_9BACT Uncharacterized protein OS=Niabella soli DSM 19437 OX=929713 GN=NIASO_14900 PE=4 SV=1
MM1 pKa = 7.56VFDD4 pKa = 5.34EE5 pKa = 5.95GPQQVQCWGFFLPIMLIMTNNAQLRR30 pKa = 11.84LHH32 pKa = 7.05KK33 pKa = 9.99KK34 pKa = 10.03RR35 pKa = 11.84KK36 pKa = 8.13IFEE39 pKa = 4.15NRR41 pKa = 11.84RR42 pKa = 11.84SACNYY47 pKa = 8.95ARR49 pKa = 11.84NGFIWTGFDD58 pKa = 3.56AVILRR63 pKa = 11.84LPLQWQHH70 pKa = 5.87RR71 pKa = 11.84QGQITTVVAA80 pKa = 4.14
MM1 pKa = 7.56VFDD4 pKa = 5.34EE5 pKa = 5.95GPQQVQCWGFFLPIMLIMTNNAQLRR30 pKa = 11.84LHH32 pKa = 7.05KK33 pKa = 9.99KK34 pKa = 10.03RR35 pKa = 11.84KK36 pKa = 8.13IFEE39 pKa = 4.15NRR41 pKa = 11.84RR42 pKa = 11.84SACNYY47 pKa = 8.95ARR49 pKa = 11.84NGFIWTGFDD58 pKa = 3.56AVILRR63 pKa = 11.84LPLQWQHH70 pKa = 5.87RR71 pKa = 11.84QGQITTVVAA80 pKa = 4.14
Molecular weight: 9.45 kDa
Isoelectric point according different methods:
Peptides (in silico digests for buttom-up proteomics)
Below you can find in silico digests of the whole proteome with Trypsin, Chymotrypsin, Trypsin+LysC, LysN, ArgC proteases suitable for different mass spec machines.| Try ESI |
 |
|---|
| ChTry ESI |
|
|---|
| ArgC ESI |
|
|---|
| LysN ESI |
|
|---|
| TryLysC ESI |
|
|---|
| Try MALDI |
|
|---|
| ChTry MALDI |
|
|---|
| ArgC MALDI |
|
|---|
| LysN MALDI |
|
|---|
| TryLysC MALDI |
|
|---|
| Try LTQ |
|
|---|
| ChTry LTQ |
|
|---|
| ArgC LTQ |
|
|---|
| LysN LTQ |
|
|---|
| TryLysC LTQ |
|
|---|
| Try MSlow |
|
|---|
| ChTry MSlow |
|
|---|
| ArgC MSlow |
|
|---|
| LysN MSlow |
|
|---|
| TryLysC MSlow |
|
|---|
| Try MShigh |
|
|---|
| ChTry MShigh |
|
|---|
| ArgC MShigh |
|
|---|
| LysN MShigh |
|
|---|
| TryLysC MShigh |
|
|---|
General Statistics
Number of major isoforms |
Number of additional isoforms |
Number of all proteins |
Number of amino acids |
Min. Seq. Length |
Max. Seq. Length |
Avg. Seq. Length |
Avg. Mol. Weight |
|---|---|---|---|---|---|---|---|
0 |
1373064 |
29 |
2870 |
334.1 |
37.37 |
Amino acid frequency
Ala |
Cys |
Asp |
Glu |
Phe |
Gly |
His |
Ile |
Lys |
Leu |
|---|---|---|---|---|---|---|---|---|---|
8.237 ± 0.039 | 0.846 ± 0.012 |
5.17 ± 0.022 | 5.311 ± 0.041 |
4.835 ± 0.027 | 7.184 ± 0.034 |
1.885 ± 0.018 | 6.791 ± 0.03 |
6.935 ± 0.033 | 9.423 ± 0.034 |
Met |
Asn |
Gln |
Pro |
Arg |
Ser |
Thr |
Val |
Trp |
Tyr |
|---|---|---|---|---|---|---|---|---|---|
2.311 ± 0.014 | 5.347 ± 0.038 |
4.164 ± 0.021 | 3.876 ± 0.02 |
4.242 ± 0.025 | 5.868 ± 0.028 |
5.799 ± 0.025 | 6.319 ± 0.024 |
1.371 ± 0.015 | 4.086 ± 0.026 |
Most of the basic statistics you can see at this page can be downloaded from this CSV file
See this proteome in:

Proteome-pI is available under Creative Commons Attribution-NoDerivs license, for more details see here
| Reference: Kozlowski LP. Proteome-pI 2.0: Proteome Isoelectric Point Database Update. Nucleic Acids Res. 2021, doi: 10.1093/nar/gkab944 | Contact: Lukasz P. Kozlowski |