Tamlana carrageenivorans
Taxonomy: cellular organisms; Bacteria; FCB group; Bacteroidetes/Chlorobi group; Bacteroidetes; Flavobacteriia; Flavobacteriales; Flavobacteriaceae; Tamlana
Average proteome isoelectric point is 6.63
Get precalculated fractions of proteins
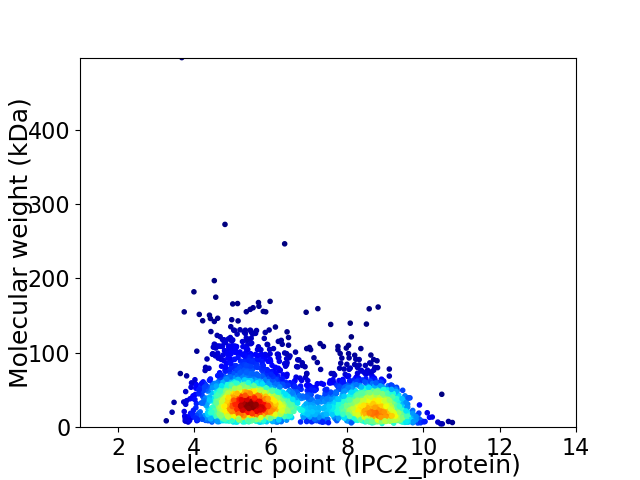
Virtual 2D-PAGE plot for 3310 proteins (isoelectric point calculated using IPC2_protein)
Get csv file with sequences according to given criteria:
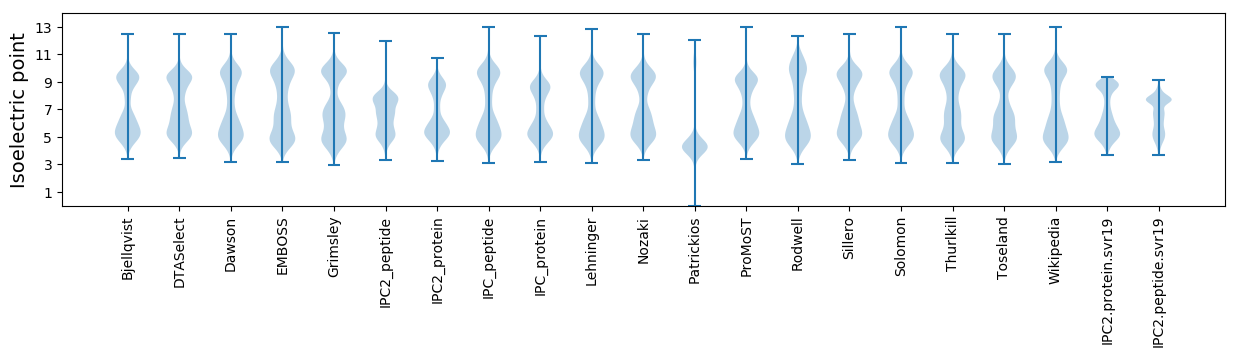
* You can choose from 21 different methods for calculating isoelectric point
Summary statistics related to proteome-wise predictions
Protein with the lowest isoelectric point:
>tr|A0A2I7SDN7|A0A2I7SDN7_9FLAO Transcriptional regulator OS=Tamlana carrageenivorans OX=2069432 GN=C1A40_00250 PE=4 SV=1
MM1 pKa = 7.74KK2 pKa = 10.48LMKK5 pKa = 10.57LSLFVLGLATCFLSCKK21 pKa = 10.13KK22 pKa = 10.65DD23 pKa = 3.64DD24 pKa = 5.25DD25 pKa = 5.42DD26 pKa = 6.83DD27 pKa = 4.03GTTIEE32 pKa = 4.0VRR34 pKa = 11.84DD35 pKa = 3.59RR36 pKa = 11.84AEE38 pKa = 3.59QQIEE42 pKa = 4.32DD43 pKa = 3.81KK44 pKa = 11.28ALLLDD49 pKa = 3.87YY50 pKa = 11.41LEE52 pKa = 4.12THH54 pKa = 6.86YY55 pKa = 11.61YY56 pKa = 8.72NASDD60 pKa = 4.08FDD62 pKa = 4.32GSNPDD67 pKa = 3.8PKK69 pKa = 11.01SIDD72 pKa = 3.35IEE74 pKa = 4.02ITEE77 pKa = 4.25LKK79 pKa = 10.57EE80 pKa = 3.99NEE82 pKa = 4.4TVPTGHH88 pKa = 7.54RR89 pKa = 11.84LLIQDD94 pKa = 4.79TIMKK98 pKa = 9.65YY99 pKa = 7.11VTYY102 pKa = 10.8YY103 pKa = 10.18DD104 pKa = 3.57VKK106 pKa = 10.99YY107 pKa = 10.21EE108 pKa = 4.39IYY110 pKa = 11.0YY111 pKa = 10.7LDD113 pKa = 3.92LNKK116 pKa = 10.49NVDD119 pKa = 3.24KK120 pKa = 10.08TAPSPHH126 pKa = 6.17FCDD129 pKa = 4.46NVVTNYY135 pKa = 10.76KK136 pKa = 10.72GFTLDD141 pKa = 3.67NEE143 pKa = 4.37VFDD146 pKa = 4.98RR147 pKa = 11.84SEE149 pKa = 3.83TGAFNSDD156 pKa = 3.5LLNNIDD162 pKa = 3.06AWQIVIPEE170 pKa = 4.94FYY172 pKa = 9.55TAEE175 pKa = 3.61AFMEE179 pKa = 4.58NNDD182 pKa = 3.4GTSNYY187 pKa = 8.62INHH190 pKa = 6.63GVGVMFAPSGLGYY203 pKa = 10.28FSSVRR208 pKa = 11.84PGIPSYY214 pKa = 11.38SCLVFNFDD222 pKa = 3.51VLQMFEE228 pKa = 4.52NDD230 pKa = 3.19HH231 pKa = 7.23DD232 pKa = 5.03GDD234 pKa = 4.21GVPSYY239 pKa = 11.23KK240 pKa = 10.25EE241 pKa = 3.98DD242 pKa = 3.76LNGDD246 pKa = 3.61GKK248 pKa = 9.85FTYY251 pKa = 10.5NSAEE255 pKa = 4.08GVFDD259 pKa = 5.95GDD261 pKa = 3.73DD262 pKa = 3.43TDD264 pKa = 5.21ANGILDD270 pKa = 5.12FVDD273 pKa = 3.68TDD275 pKa = 3.97DD276 pKa = 6.28DD277 pKa = 5.09GDD279 pKa = 4.17GVLTIYY285 pKa = 10.96EE286 pKa = 5.12DD287 pKa = 3.44IDD289 pKa = 4.7GDD291 pKa = 4.12GDD293 pKa = 3.69PTNDD297 pKa = 3.06IGKK300 pKa = 9.62NGIPKK305 pKa = 10.24YY306 pKa = 10.35LDD308 pKa = 3.66PEE310 pKa = 4.19EE311 pKa = 4.78TEE313 pKa = 4.02ANYY316 pKa = 10.62DD317 pKa = 3.16II318 pKa = 5.62
MM1 pKa = 7.74KK2 pKa = 10.48LMKK5 pKa = 10.57LSLFVLGLATCFLSCKK21 pKa = 10.13KK22 pKa = 10.65DD23 pKa = 3.64DD24 pKa = 5.25DD25 pKa = 5.42DD26 pKa = 6.83DD27 pKa = 4.03GTTIEE32 pKa = 4.0VRR34 pKa = 11.84DD35 pKa = 3.59RR36 pKa = 11.84AEE38 pKa = 3.59QQIEE42 pKa = 4.32DD43 pKa = 3.81KK44 pKa = 11.28ALLLDD49 pKa = 3.87YY50 pKa = 11.41LEE52 pKa = 4.12THH54 pKa = 6.86YY55 pKa = 11.61YY56 pKa = 8.72NASDD60 pKa = 4.08FDD62 pKa = 4.32GSNPDD67 pKa = 3.8PKK69 pKa = 11.01SIDD72 pKa = 3.35IEE74 pKa = 4.02ITEE77 pKa = 4.25LKK79 pKa = 10.57EE80 pKa = 3.99NEE82 pKa = 4.4TVPTGHH88 pKa = 7.54RR89 pKa = 11.84LLIQDD94 pKa = 4.79TIMKK98 pKa = 9.65YY99 pKa = 7.11VTYY102 pKa = 10.8YY103 pKa = 10.18DD104 pKa = 3.57VKK106 pKa = 10.99YY107 pKa = 10.21EE108 pKa = 4.39IYY110 pKa = 11.0YY111 pKa = 10.7LDD113 pKa = 3.92LNKK116 pKa = 10.49NVDD119 pKa = 3.24KK120 pKa = 10.08TAPSPHH126 pKa = 6.17FCDD129 pKa = 4.46NVVTNYY135 pKa = 10.76KK136 pKa = 10.72GFTLDD141 pKa = 3.67NEE143 pKa = 4.37VFDD146 pKa = 4.98RR147 pKa = 11.84SEE149 pKa = 3.83TGAFNSDD156 pKa = 3.5LLNNIDD162 pKa = 3.06AWQIVIPEE170 pKa = 4.94FYY172 pKa = 9.55TAEE175 pKa = 3.61AFMEE179 pKa = 4.58NNDD182 pKa = 3.4GTSNYY187 pKa = 8.62INHH190 pKa = 6.63GVGVMFAPSGLGYY203 pKa = 10.28FSSVRR208 pKa = 11.84PGIPSYY214 pKa = 11.38SCLVFNFDD222 pKa = 3.51VLQMFEE228 pKa = 4.52NDD230 pKa = 3.19HH231 pKa = 7.23DD232 pKa = 5.03GDD234 pKa = 4.21GVPSYY239 pKa = 11.23KK240 pKa = 10.25EE241 pKa = 3.98DD242 pKa = 3.76LNGDD246 pKa = 3.61GKK248 pKa = 9.85FTYY251 pKa = 10.5NSAEE255 pKa = 4.08GVFDD259 pKa = 5.95GDD261 pKa = 3.73DD262 pKa = 3.43TDD264 pKa = 5.21ANGILDD270 pKa = 5.12FVDD273 pKa = 3.68TDD275 pKa = 3.97DD276 pKa = 6.28DD277 pKa = 5.09GDD279 pKa = 4.17GVLTIYY285 pKa = 10.96EE286 pKa = 5.12DD287 pKa = 3.44IDD289 pKa = 4.7GDD291 pKa = 4.12GDD293 pKa = 3.69PTNDD297 pKa = 3.06IGKK300 pKa = 9.62NGIPKK305 pKa = 10.24YY306 pKa = 10.35LDD308 pKa = 3.66PEE310 pKa = 4.19EE311 pKa = 4.78TEE313 pKa = 4.02ANYY316 pKa = 10.62DD317 pKa = 3.16II318 pKa = 5.62
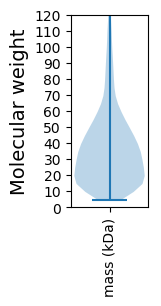
Molecular weight: 35.67 kDa
Isoelectric point according different methods:
Protein with the highest isoelectric point:
>tr|A0A2I7SE80|A0A2I7SE80_9FLAO 50S ribosomal protein L31 OS=Tamlana carrageenivorans OX=2069432 GN=C1A40_01300 PE=3 SV=1
MM1 pKa = 7.69SKK3 pKa = 9.01RR4 pKa = 11.84TFQPSKK10 pKa = 9.13RR11 pKa = 11.84KK12 pKa = 9.48RR13 pKa = 11.84RR14 pKa = 11.84NKK16 pKa = 9.49HH17 pKa = 3.94GFRR20 pKa = 11.84EE21 pKa = 4.27RR22 pKa = 11.84MASANGRR29 pKa = 11.84KK30 pKa = 9.04VLARR34 pKa = 11.84RR35 pKa = 11.84RR36 pKa = 11.84AKK38 pKa = 10.09GRR40 pKa = 11.84KK41 pKa = 7.97KK42 pKa = 10.72LSVSSEE48 pKa = 3.76ARR50 pKa = 11.84HH51 pKa = 5.78KK52 pKa = 10.72KK53 pKa = 9.83
MM1 pKa = 7.69SKK3 pKa = 9.01RR4 pKa = 11.84TFQPSKK10 pKa = 9.13RR11 pKa = 11.84KK12 pKa = 9.48RR13 pKa = 11.84RR14 pKa = 11.84NKK16 pKa = 9.49HH17 pKa = 3.94GFRR20 pKa = 11.84EE21 pKa = 4.27RR22 pKa = 11.84MASANGRR29 pKa = 11.84KK30 pKa = 9.04VLARR34 pKa = 11.84RR35 pKa = 11.84RR36 pKa = 11.84AKK38 pKa = 10.09GRR40 pKa = 11.84KK41 pKa = 7.97KK42 pKa = 10.72LSVSSEE48 pKa = 3.76ARR50 pKa = 11.84HH51 pKa = 5.78KK52 pKa = 10.72KK53 pKa = 9.83
Molecular weight: 6.29 kDa
Isoelectric point according different methods:
Peptides (in silico digests for buttom-up proteomics)
Below you can find in silico digests of the whole proteome with Trypsin, Chymotrypsin, Trypsin+LysC, LysN, ArgC proteases suitable for different mass spec machines.| Try ESI |
 |
|---|
| ChTry ESI |
|
|---|
| ArgC ESI |
|
|---|
| LysN ESI |
|
|---|
| TryLysC ESI |
|
|---|
| Try MALDI |
|
|---|
| ChTry MALDI |
|
|---|
| ArgC MALDI |
|
|---|
| LysN MALDI |
|
|---|
| TryLysC MALDI |
|
|---|
| Try LTQ |
|
|---|
| ChTry LTQ |
|
|---|
| ArgC LTQ |
|
|---|
| LysN LTQ |
|
|---|
| TryLysC LTQ |
|
|---|
| Try MSlow |
|
|---|
| ChTry MSlow |
|
|---|
| ArgC MSlow |
|
|---|
| LysN MSlow |
|
|---|
| TryLysC MSlow |
|
|---|
| Try MShigh |
|
|---|
| ChTry MShigh |
|
|---|
| ArgC MShigh |
|
|---|
| LysN MShigh |
|
|---|
| TryLysC MShigh |
|
|---|
General Statistics
Number of major isoforms |
Number of additional isoforms |
Number of all proteins |
Number of amino acids |
Min. Seq. Length |
Max. Seq. Length |
Avg. Seq. Length |
Avg. Mol. Weight |
|---|---|---|---|---|---|---|---|
0 |
1129353 |
38 |
4718 |
341.2 |
38.5 |
Amino acid frequency
Ala |
Cys |
Asp |
Glu |
Phe |
Gly |
His |
Ile |
Lys |
Leu |
|---|---|---|---|---|---|---|---|---|---|
6.538 ± 0.045 | 0.804 ± 0.015 |
5.682 ± 0.035 | 6.45 ± 0.04 |
5.092 ± 0.031 | 6.323 ± 0.044 |
1.967 ± 0.02 | 7.74 ± 0.037 |
7.919 ± 0.053 | 9.175 ± 0.048 |
Met |
Asn |
Gln |
Pro |
Arg |
Ser |
Thr |
Val |
Trp |
Tyr |
|---|---|---|---|---|---|---|---|---|---|
2.133 ± 0.018 | 6.194 ± 0.04 |
3.361 ± 0.025 | 3.419 ± 0.023 |
3.45 ± 0.026 | 6.458 ± 0.036 |
5.809 ± 0.048 | 6.294 ± 0.031 |
1.087 ± 0.015 | 4.105 ± 0.028 |
Most of the basic statistics you can see at this page can be downloaded from this CSV file
See this proteome in:

Proteome-pI is available under Creative Commons Attribution-NoDerivs license, for more details see here
| Reference: Kozlowski LP. Proteome-pI 2.0: Proteome Isoelectric Point Database Update. Nucleic Acids Res. 2021, doi: 10.1093/nar/gkab944 | Contact: Lukasz P. Kozlowski |