Synechococcus phage metaG-MbCM1
Taxonomy: Viruses; Duplodnaviria; Heunggongvirae; Uroviricota; Caudoviricetes; Caudovirales; Myoviridae; unclassified Myoviridae
Average proteome isoelectric point is 5.77
Get precalculated fractions of proteins
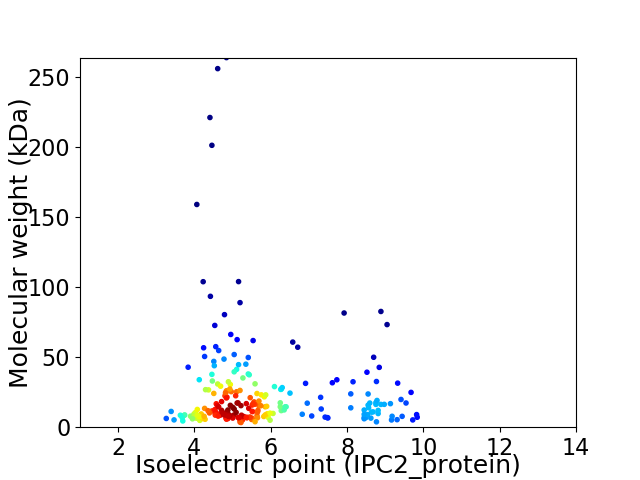
Virtual 2D-PAGE plot for 234 proteins (isoelectric point calculated using IPC2_protein)
Get csv file with sequences according to given criteria:
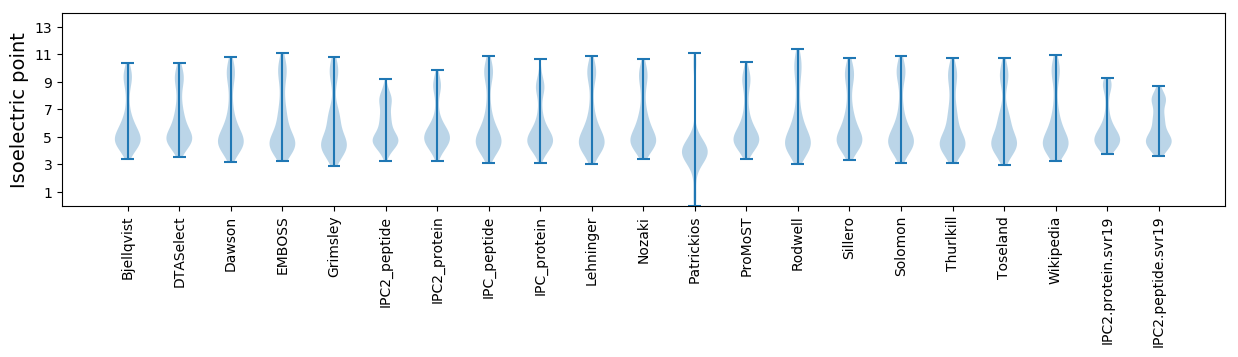
* You can choose from 21 different methods for calculating isoelectric point
Summary statistics related to proteome-wise predictions
Protein with the lowest isoelectric point:
>tr|H8ZNK7|H8ZNK7_9CAUD Uncharacterized protein OS=Synechococcus phage metaG-MbCM1 OX=1079999 PE=4 SV=1
MM1 pKa = 7.67LIALATLVTIGAFILGITVSWLAKK25 pKa = 10.34GYY27 pKa = 10.55VEE29 pKa = 6.23DD30 pKa = 4.57YY31 pKa = 10.93IEE33 pKa = 4.03NAAYY37 pKa = 9.89AKK39 pKa = 10.38SVTHH43 pKa = 7.03PEE45 pKa = 3.98MLDD48 pKa = 3.18EE49 pKa = 5.86DD50 pKa = 5.06GNILHH55 pKa = 7.6DD56 pKa = 3.72EE57 pKa = 4.81LIYY60 pKa = 10.83VRR62 pKa = 11.84PTSPWDD68 pKa = 3.37IQDD71 pKa = 4.55LDD73 pKa = 4.7DD74 pKa = 6.13DD75 pKa = 4.71EE76 pKa = 6.24EE77 pKa = 4.46DD78 pKa = 3.36
MM1 pKa = 7.67LIALATLVTIGAFILGITVSWLAKK25 pKa = 10.34GYY27 pKa = 10.55VEE29 pKa = 6.23DD30 pKa = 4.57YY31 pKa = 10.93IEE33 pKa = 4.03NAAYY37 pKa = 9.89AKK39 pKa = 10.38SVTHH43 pKa = 7.03PEE45 pKa = 3.98MLDD48 pKa = 3.18EE49 pKa = 5.86DD50 pKa = 5.06GNILHH55 pKa = 7.6DD56 pKa = 3.72EE57 pKa = 4.81LIYY60 pKa = 10.83VRR62 pKa = 11.84PTSPWDD68 pKa = 3.37IQDD71 pKa = 4.55LDD73 pKa = 4.7DD74 pKa = 6.13DD75 pKa = 4.71EE76 pKa = 6.24EE77 pKa = 4.46DD78 pKa = 3.36
Molecular weight: 8.75 kDa
Isoelectric point according different methods:
Protein with the highest isoelectric point:
>tr|H8ZN64|H8ZN64_9CAUD Uncharacterized protein OS=Synechococcus phage metaG-MbCM1 OX=1079999 PE=4 SV=1
MM1 pKa = 7.64LLNIKK6 pKa = 10.09INLLLLTIPRR16 pKa = 11.84LISQVIVLLARR27 pKa = 11.84NLPIVNDD34 pKa = 3.83SQQTQIFLTDD44 pKa = 3.86YY45 pKa = 10.33QQLWYY50 pKa = 9.86NNSVRR55 pKa = 11.84VQRR58 pKa = 11.84FLL60 pKa = 3.94
MM1 pKa = 7.64LLNIKK6 pKa = 10.09INLLLLTIPRR16 pKa = 11.84LISQVIVLLARR27 pKa = 11.84NLPIVNDD34 pKa = 3.83SQQTQIFLTDD44 pKa = 3.86YY45 pKa = 10.33QQLWYY50 pKa = 9.86NNSVRR55 pKa = 11.84VQRR58 pKa = 11.84FLL60 pKa = 3.94
Molecular weight: 7.11 kDa
Isoelectric point according different methods:
Peptides (in silico digests for buttom-up proteomics)
Below you can find in silico digests of the whole proteome with Trypsin, Chymotrypsin, Trypsin+LysC, LysN, ArgC proteases suitable for different mass spec machines.| Try ESI |
 |
|---|
| ChTry ESI |
|
|---|
| ArgC ESI |
|
|---|
| LysN ESI |
|
|---|
| TryLysC ESI |
|
|---|
| Try MALDI |
|
|---|
| ChTry MALDI |
|
|---|
| ArgC MALDI |
|
|---|
| LysN MALDI |
|
|---|
| TryLysC MALDI |
|
|---|
| Try LTQ |
|
|---|
| ChTry LTQ |
|
|---|
| ArgC LTQ |
|
|---|
| LysN LTQ |
|
|---|
| TryLysC LTQ |
|
|---|
| Try MSlow |
|
|---|
| ChTry MSlow |
|
|---|
| ArgC MSlow |
|
|---|
| LysN MSlow |
|
|---|
| TryLysC MSlow |
|
|---|
| Try MShigh |
|
|---|
| ChTry MShigh |
|
|---|
| ArgC MShigh |
|
|---|
| LysN MShigh |
|
|---|
| TryLysC MShigh |
|
|---|
General Statistics
Number of major isoforms |
Number of additional isoforms |
Number of all proteins |
Number of amino acids |
Min. Seq. Length |
Max. Seq. Length |
Avg. Seq. Length |
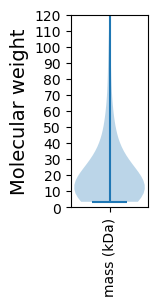
Avg. Mol. Weight |
|---|---|---|---|---|---|---|---|
0 |
52596 |
30 |
2409 |
224.8 |
24.88 |
Amino acid frequency
Ala |
Cys |
Asp |
Glu |
Phe |
Gly |
His |
Ile |
Lys |
Leu |
|---|---|---|---|---|---|---|---|---|---|
7.004 ± 0.211 | 0.913 ± 0.079 |
6.548 ± 0.119 | 5.727 ± 0.218 |
4.297 ± 0.103 | 7.879 ± 0.288 |
1.538 ± 0.098 | 5.995 ± 0.154 |
5.805 ± 0.312 | 7.172 ± 0.172 |
Met |
Asn |
Gln |
Pro |
Arg |
Ser |
Thr |
Val |
Trp |
Tyr |
|---|---|---|---|---|---|---|---|---|---|
2.205 ± 0.167 | 5.864 ± 0.16 |
3.862 ± 0.164 | 3.793 ± 0.109 |
3.9 ± 0.145 | 7.312 ± 0.22 |
7.976 ± 0.393 | 6.888 ± 0.17 |
1.078 ± 0.084 | 4.246 ± 0.145 |
Most of the basic statistics you can see at this page can be downloaded from this CSV file
See this proteome in:

Proteome-pI is available under Creative Commons Attribution-NoDerivs license, for more details see here
| Reference: Kozlowski LP. Proteome-pI 2.0: Proteome Isoelectric Point Database Update. Nucleic Acids Res. 2021, doi: 10.1093/nar/gkab944 | Contact: Lukasz P. Kozlowski |