Mytilinidion resinicola
Taxonomy: cellular organisms; Eukaryota; Opisthokonta; Fungi; Dikarya; Ascomycota; saccharomyceta; Pezizomycotina; leotiomyceta; dothideomyceta; Dothideomycetes; Pleosporomycetidae; Mytilinidiales; Mytilinidiaceae; Mytilinidion
Average proteome isoelectric point is 6.75
Get precalculated fractions of proteins
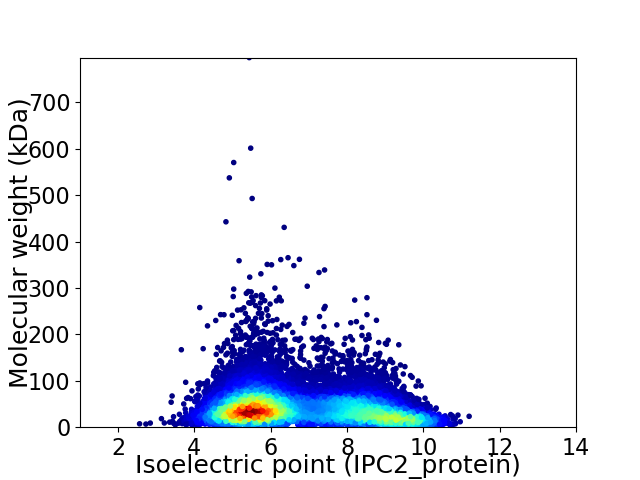
Virtual 2D-PAGE plot for 16739 proteins (isoelectric point calculated using IPC2_protein)
Get csv file with sequences according to given criteria:
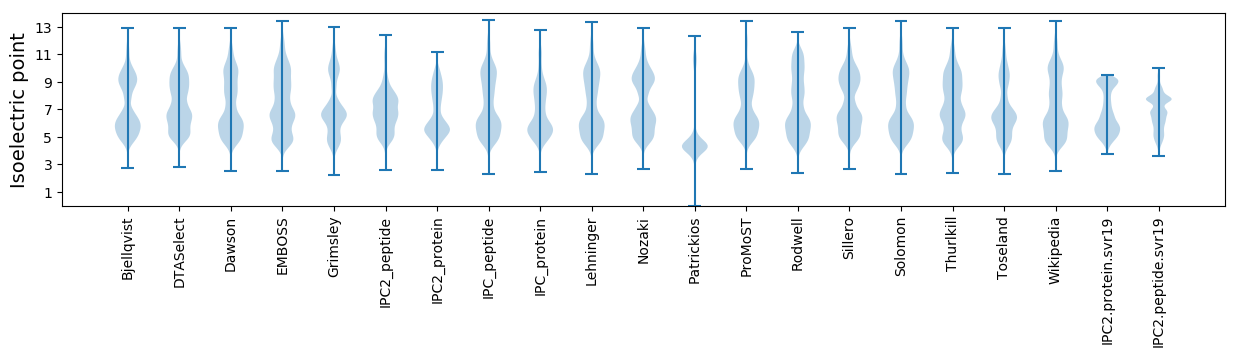
* You can choose from 21 different methods for calculating isoelectric point
Summary statistics related to proteome-wise predictions
Protein with the lowest isoelectric point:
>tr|A0A6A6YVN4|A0A6A6YVN4_9PEZI WD repeat-containing protein 57 OS=Mytilinidion resinicola OX=574789 GN=BDZ99DRAFT_460330 PE=4 SV=1
MM1 pKa = 7.53HH2 pKa = 7.19SLSTFACRR10 pKa = 11.84IGLLALTARR19 pKa = 11.84SALADD24 pKa = 3.63CVSFGMDD31 pKa = 3.43FQDD34 pKa = 4.05GGSYY38 pKa = 9.79FQNSLSSDD46 pKa = 3.21PFTFVSQFEE55 pKa = 4.48GCDD58 pKa = 3.01NDD60 pKa = 3.6TATNVFVDD68 pKa = 4.08PNGDD72 pKa = 3.22QYY74 pKa = 12.04LCTDD78 pKa = 3.99TNLQPDD84 pKa = 4.14DD85 pKa = 3.8TDD87 pKa = 3.9EE88 pKa = 6.09LSTCPLDD95 pKa = 5.78KK96 pKa = 10.95DD97 pKa = 4.24QLWSGPWSILILSNNGNDD115 pKa = 3.45APIAYY120 pKa = 9.29EE121 pKa = 4.0RR122 pKa = 11.84DD123 pKa = 3.55FEE125 pKa = 5.43LSVGPQNTSTVCFPSLLSTQVVTNEE150 pKa = 3.99RR151 pKa = 11.84SSTHH155 pKa = 5.45PQVFQKK161 pKa = 9.95TSS163 pKa = 2.7
MM1 pKa = 7.53HH2 pKa = 7.19SLSTFACRR10 pKa = 11.84IGLLALTARR19 pKa = 11.84SALADD24 pKa = 3.63CVSFGMDD31 pKa = 3.43FQDD34 pKa = 4.05GGSYY38 pKa = 9.79FQNSLSSDD46 pKa = 3.21PFTFVSQFEE55 pKa = 4.48GCDD58 pKa = 3.01NDD60 pKa = 3.6TATNVFVDD68 pKa = 4.08PNGDD72 pKa = 3.22QYY74 pKa = 12.04LCTDD78 pKa = 3.99TNLQPDD84 pKa = 4.14DD85 pKa = 3.8TDD87 pKa = 3.9EE88 pKa = 6.09LSTCPLDD95 pKa = 5.78KK96 pKa = 10.95DD97 pKa = 4.24QLWSGPWSILILSNNGNDD115 pKa = 3.45APIAYY120 pKa = 9.29EE121 pKa = 4.0RR122 pKa = 11.84DD123 pKa = 3.55FEE125 pKa = 5.43LSVGPQNTSTVCFPSLLSTQVVTNEE150 pKa = 3.99RR151 pKa = 11.84SSTHH155 pKa = 5.45PQVFQKK161 pKa = 9.95TSS163 pKa = 2.7
Molecular weight: 17.81 kDa
Isoelectric point according different methods:
Protein with the highest isoelectric point:
>tr|A0A6A6Z455|A0A6A6Z455_9PEZI Tyrosinase OS=Mytilinidion resinicola OX=574789 GN=BDZ99DRAFT_379186 PE=3 SV=1
MM1 pKa = 7.14QLISPMTISMPTAGSLSTALSPLSAPRR28 pKa = 11.84MLPTMTPKK36 pKa = 9.73TRR38 pKa = 11.84SLRR41 pKa = 11.84AVFLLKK47 pKa = 10.28KK48 pKa = 9.92HH49 pKa = 4.73QTLPPRR55 pKa = 11.84RR56 pKa = 11.84LHH58 pKa = 6.73RR59 pKa = 11.84PPPQPLHH66 pKa = 6.09HH67 pKa = 6.64QPLSQPLPQHH77 pKa = 6.7LARR80 pKa = 11.84PLQPLRR86 pKa = 11.84SLKK89 pKa = 9.6QQQLHH94 pKa = 5.98SPKK97 pKa = 9.72QQPSRR102 pKa = 11.84LLKK105 pKa = 9.86RR106 pKa = 11.84QRR108 pKa = 11.84IQLPRR113 pKa = 11.84KK114 pKa = 9.09HH115 pKa = 6.53RR116 pKa = 11.84LHH118 pKa = 7.1PSRR121 pKa = 11.84LLSPPQHH128 pKa = 5.9RR129 pKa = 11.84RR130 pKa = 11.84PRR132 pKa = 11.84RR133 pKa = 11.84HH134 pKa = 4.71QNQRR138 pKa = 11.84QRR140 pKa = 11.84PRR142 pKa = 11.84QPHH145 pKa = 5.01WQHH148 pKa = 5.93KK149 pKa = 9.37QPLHH153 pKa = 5.11PTRR156 pKa = 11.84VALCPHH162 pKa = 7.19RR163 pKa = 11.84LTRR166 pKa = 11.84QTRR169 pKa = 11.84SASHH173 pKa = 4.61QQGLQKK179 pKa = 10.29LRR181 pKa = 11.84KK182 pKa = 8.47PRR184 pKa = 11.84QEE186 pKa = 4.26PPPKK190 pKa = 9.7PRR192 pKa = 11.84QQAPGPRR199 pKa = 11.84RR200 pKa = 3.32
MM1 pKa = 7.14QLISPMTISMPTAGSLSTALSPLSAPRR28 pKa = 11.84MLPTMTPKK36 pKa = 9.73TRR38 pKa = 11.84SLRR41 pKa = 11.84AVFLLKK47 pKa = 10.28KK48 pKa = 9.92HH49 pKa = 4.73QTLPPRR55 pKa = 11.84RR56 pKa = 11.84LHH58 pKa = 6.73RR59 pKa = 11.84PPPQPLHH66 pKa = 6.09HH67 pKa = 6.64QPLSQPLPQHH77 pKa = 6.7LARR80 pKa = 11.84PLQPLRR86 pKa = 11.84SLKK89 pKa = 9.6QQQLHH94 pKa = 5.98SPKK97 pKa = 9.72QQPSRR102 pKa = 11.84LLKK105 pKa = 9.86RR106 pKa = 11.84QRR108 pKa = 11.84IQLPRR113 pKa = 11.84KK114 pKa = 9.09HH115 pKa = 6.53RR116 pKa = 11.84LHH118 pKa = 7.1PSRR121 pKa = 11.84LLSPPQHH128 pKa = 5.9RR129 pKa = 11.84RR130 pKa = 11.84PRR132 pKa = 11.84RR133 pKa = 11.84HH134 pKa = 4.71QNQRR138 pKa = 11.84QRR140 pKa = 11.84PRR142 pKa = 11.84QPHH145 pKa = 5.01WQHH148 pKa = 5.93KK149 pKa = 9.37QPLHH153 pKa = 5.11PTRR156 pKa = 11.84VALCPHH162 pKa = 7.19RR163 pKa = 11.84LTRR166 pKa = 11.84QTRR169 pKa = 11.84SASHH173 pKa = 4.61QQGLQKK179 pKa = 10.29LRR181 pKa = 11.84KK182 pKa = 8.47PRR184 pKa = 11.84QEE186 pKa = 4.26PPPKK190 pKa = 9.7PRR192 pKa = 11.84QQAPGPRR199 pKa = 11.84RR200 pKa = 3.32
Molecular weight: 23.47 kDa
Isoelectric point according different methods:
Peptides (in silico digests for buttom-up proteomics)
Below you can find in silico digests of the whole proteome with Trypsin, Chymotrypsin, Trypsin+LysC, LysN, ArgC proteases suitable for different mass spec machines.| Try ESI |
 |
|---|
| ChTry ESI |
|
|---|
| ArgC ESI |
|
|---|
| LysN ESI |
|
|---|
| TryLysC ESI |
|
|---|
| Try MALDI |
|
|---|
| ChTry MALDI |
|
|---|
| ArgC MALDI |
|
|---|
| LysN MALDI |
|
|---|
| TryLysC MALDI |
|
|---|
| Try LTQ |
|
|---|
| ChTry LTQ |
|
|---|
| ArgC LTQ |
|
|---|
| LysN LTQ |
|
|---|
| TryLysC LTQ |
|
|---|
| Try MSlow |
|
|---|
| ChTry MSlow |
|
|---|
| ArgC MSlow |
|
|---|
| LysN MSlow |
|
|---|
| TryLysC MSlow |
|
|---|
| Try MShigh |
|
|---|
| ChTry MShigh |
|
|---|
| ArgC MShigh |
|
|---|
| LysN MShigh |
|
|---|
| TryLysC MShigh |
|
|---|
General Statistics
Number of major isoforms |
Number of additional isoforms |
Number of all proteins |
Number of amino acids |
Min. Seq. Length |
Max. Seq. Length |
Avg. Seq. Length |
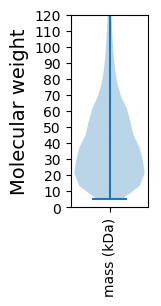
Avg. Mol. Weight |
|---|---|---|---|---|---|---|---|
0 |
6754280 |
49 |
7174 |
403.5 |
44.7 |
Amino acid frequency
Ala |
Cys |
Asp |
Glu |
Phe |
Gly |
His |
Ile |
Lys |
Leu |
|---|---|---|---|---|---|---|---|---|---|
8.749 ± 0.017 | 1.334 ± 0.008 |
5.497 ± 0.014 | 6.214 ± 0.021 |
3.735 ± 0.011 | 6.803 ± 0.018 |
2.467 ± 0.009 | 4.896 ± 0.013 |
4.949 ± 0.018 | 9.006 ± 0.02 |
Met |
Asn |
Gln |
Pro |
Arg |
Ser |
Thr |
Val |
Trp |
Tyr |
|---|---|---|---|---|---|---|---|---|---|
2.121 ± 0.007 | 3.558 ± 0.011 |
6.146 ± 0.022 | 3.813 ± 0.015 |
6.235 ± 0.017 | 8.132 ± 0.023 |
5.999 ± 0.012 | 6.049 ± 0.014 |
1.536 ± 0.007 | 2.761 ± 0.01 |
Most of the basic statistics you can see at this page can be downloaded from this CSV file
See this proteome in:

Proteome-pI is available under Creative Commons Attribution-NoDerivs license, for more details see here
| Reference: Kozlowski LP. Proteome-pI 2.0: Proteome Isoelectric Point Database Update. Nucleic Acids Res. 2021, doi: 10.1093/nar/gkab944 | Contact: Lukasz P. Kozlowski |