Mycobacterium sp. (strain KMS)
Taxonomy: cellular organisms; Bacteria; Terrabacteria group; Actinobacteria; Actinomycetia; Corynebacteriales; Mycobacteriaceae; Mycobacterium; unclassified Mycobacterium
Average proteome isoelectric point is 6.06
Get precalculated fractions of proteins
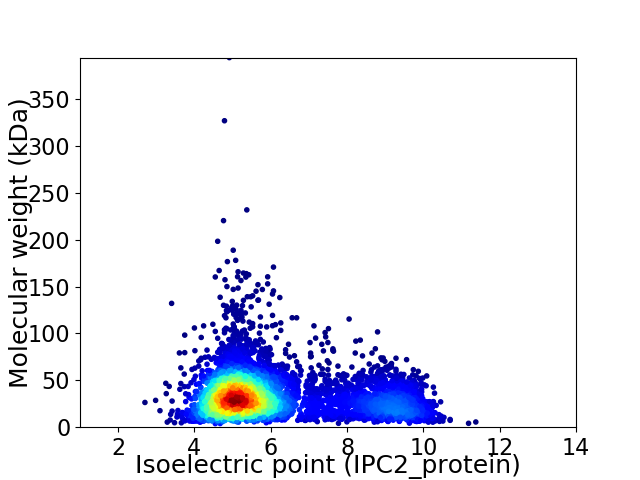
Virtual 2D-PAGE plot for 5893 proteins (isoelectric point calculated using IPC2_protein)
Get csv file with sequences according to given criteria:
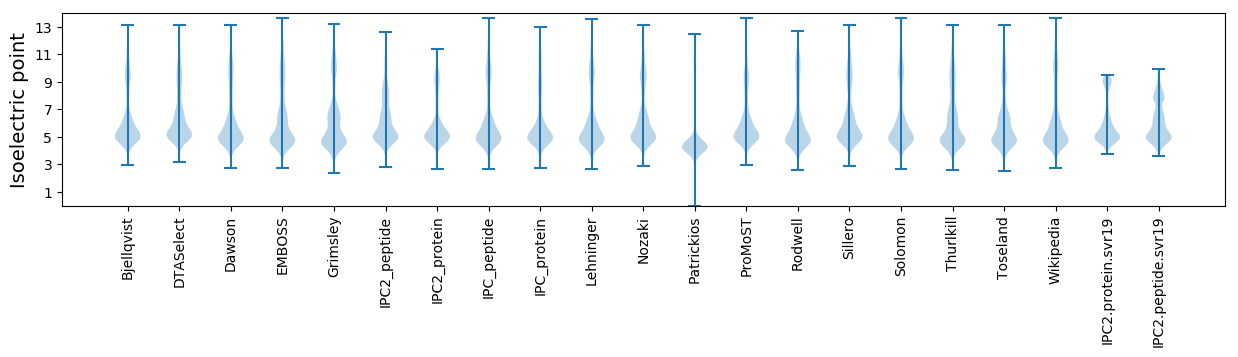
* You can choose from 21 different methods for calculating isoelectric point
Summary statistics related to proteome-wise predictions
Protein with the lowest isoelectric point:
>tr|A1UDC2|A1UDC2_MYCSK Uncharacterized protein OS=Mycobacterium sp. (strain KMS) OX=189918 GN=Mkms_1623 PE=4 SV=1
MM1 pKa = 8.18DD2 pKa = 4.0YY3 pKa = 11.34KK4 pKa = 11.23LFVCVQCGFEE14 pKa = 3.94YY15 pKa = 10.91DD16 pKa = 3.75EE17 pKa = 4.64AKK19 pKa = 10.38GWPEE23 pKa = 4.27DD24 pKa = 4.17GIAPGTRR31 pKa = 11.84WDD33 pKa = 5.68DD34 pKa = 4.13IPDD37 pKa = 3.72DD38 pKa = 4.45WSCPDD43 pKa = 3.66CGAAKK48 pKa = 10.31SDD50 pKa = 3.66FEE52 pKa = 4.32MVEE55 pKa = 4.15VARR58 pKa = 11.84GG59 pKa = 3.19
MM1 pKa = 8.18DD2 pKa = 4.0YY3 pKa = 11.34KK4 pKa = 11.23LFVCVQCGFEE14 pKa = 3.94YY15 pKa = 10.91DD16 pKa = 3.75EE17 pKa = 4.64AKK19 pKa = 10.38GWPEE23 pKa = 4.27DD24 pKa = 4.17GIAPGTRR31 pKa = 11.84WDD33 pKa = 5.68DD34 pKa = 4.13IPDD37 pKa = 3.72DD38 pKa = 4.45WSCPDD43 pKa = 3.66CGAAKK48 pKa = 10.31SDD50 pKa = 3.66FEE52 pKa = 4.32MVEE55 pKa = 4.15VARR58 pKa = 11.84GG59 pKa = 3.19
Molecular weight: 6.62 kDa
Isoelectric point according different methods:
Protein with the highest isoelectric point:
>tr|A1U8U0|A1U8U0_MYCSK FHA domain containing protein OS=Mycobacterium sp. (strain KMS) OX=189918 GN=Mkms_0029 PE=4 SV=1
MM1 pKa = 7.69AKK3 pKa = 10.06GKK5 pKa = 8.69RR6 pKa = 11.84TFQPNNRR13 pKa = 11.84RR14 pKa = 11.84RR15 pKa = 11.84ARR17 pKa = 11.84VHH19 pKa = 5.99GFRR22 pKa = 11.84LRR24 pKa = 11.84MRR26 pKa = 11.84TRR28 pKa = 11.84AGRR31 pKa = 11.84AIVTGRR37 pKa = 11.84RR38 pKa = 11.84RR39 pKa = 11.84KK40 pKa = 9.68GRR42 pKa = 11.84RR43 pKa = 11.84SLTAA47 pKa = 3.9
MM1 pKa = 7.69AKK3 pKa = 10.06GKK5 pKa = 8.69RR6 pKa = 11.84TFQPNNRR13 pKa = 11.84RR14 pKa = 11.84RR15 pKa = 11.84ARR17 pKa = 11.84VHH19 pKa = 5.99GFRR22 pKa = 11.84LRR24 pKa = 11.84MRR26 pKa = 11.84TRR28 pKa = 11.84AGRR31 pKa = 11.84AIVTGRR37 pKa = 11.84RR38 pKa = 11.84RR39 pKa = 11.84KK40 pKa = 9.68GRR42 pKa = 11.84RR43 pKa = 11.84SLTAA47 pKa = 3.9
Molecular weight: 5.56 kDa
Isoelectric point according different methods:
Peptides (in silico digests for buttom-up proteomics)
Below you can find in silico digests of the whole proteome with Trypsin, Chymotrypsin, Trypsin+LysC, LysN, ArgC proteases suitable for different mass spec machines.| Try ESI |
 |
|---|
| ChTry ESI |
|
|---|
| ArgC ESI |
|
|---|
| LysN ESI |
|
|---|
| TryLysC ESI |
|
|---|
| Try MALDI |
|
|---|
| ChTry MALDI |
|
|---|
| ArgC MALDI |
|
|---|
| LysN MALDI |
|
|---|
| TryLysC MALDI |
|
|---|
| Try LTQ |
|
|---|
| ChTry LTQ |
|
|---|
| ArgC LTQ |
|
|---|
| LysN LTQ |
|
|---|
| TryLysC LTQ |
|
|---|
| Try MSlow |
|
|---|
| ChTry MSlow |
|
|---|
| ArgC MSlow |
|
|---|
| LysN MSlow |
|
|---|
| TryLysC MSlow |
|
|---|
| Try MShigh |
|
|---|
| ChTry MShigh |
|
|---|
| ArgC MShigh |
|
|---|
| LysN MShigh |
|
|---|
| TryLysC MShigh |
|
|---|
General Statistics
Number of major isoforms |
Number of additional isoforms |
Number of all proteins |
Number of amino acids |
Min. Seq. Length |
Max. Seq. Length |
Avg. Seq. Length |
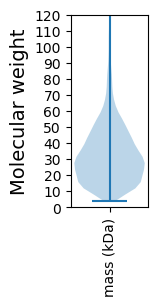
Avg. Mol. Weight |
|---|---|---|---|---|---|---|---|
0 |
1899582 |
32 |
3693 |
322.3 |
34.64 |
Amino acid frequency
Ala |
Cys |
Asp |
Glu |
Phe |
Gly |
His |
Ile |
Lys |
Leu |
|---|---|---|---|---|---|---|---|---|---|
13.116 ± 0.045 | 0.815 ± 0.009 |
6.454 ± 0.027 | 5.358 ± 0.025 |
3.0 ± 0.019 | 8.85 ± 0.038 |
2.227 ± 0.018 | 4.048 ± 0.021 |
2.063 ± 0.019 | 9.721 ± 0.034 |
Met |
Asn |
Gln |
Pro |
Arg |
Ser |
Thr |
Val |
Trp |
Tyr |
|---|---|---|---|---|---|---|---|---|---|
2.048 ± 0.014 | 2.113 ± 0.015 |
5.928 ± 0.026 | 2.899 ± 0.016 |
7.56 ± 0.033 | 5.245 ± 0.02 |
6.089 ± 0.019 | 8.827 ± 0.029 |
1.528 ± 0.015 | 2.11 ± 0.015 |
Most of the basic statistics you can see at this page can be downloaded from this CSV file
See this proteome in:

Proteome-pI is available under Creative Commons Attribution-NoDerivs license, for more details see here
| Reference: Kozlowski LP. Proteome-pI 2.0: Proteome Isoelectric Point Database Update. Nucleic Acids Res. 2021, doi: 10.1093/nar/gkab944 | Contact: Lukasz P. Kozlowski |