Phycicoccus sp. Root563
Taxonomy: cellular organisms; Bacteria; Terrabacteria group; Actinobacteria; Actinomycetia; Micrococcales; Intrasporangiaceae; Phycicoccus; unclassified Phycicoccus
Average proteome isoelectric point is 6.25
Get precalculated fractions of proteins
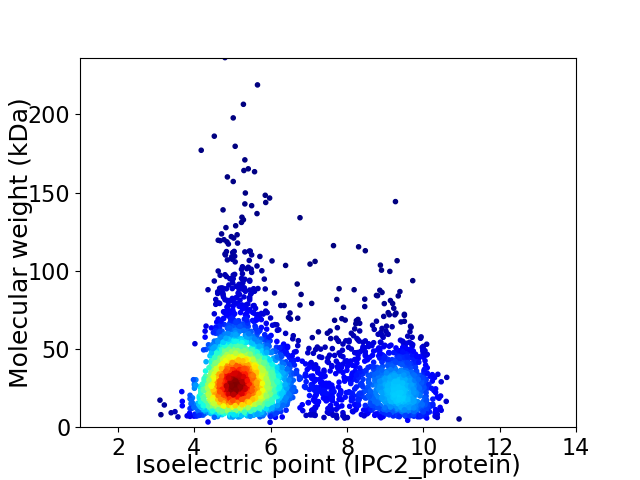
Virtual 2D-PAGE plot for 3714 proteins (isoelectric point calculated using IPC2_protein)
Get csv file with sequences according to given criteria:
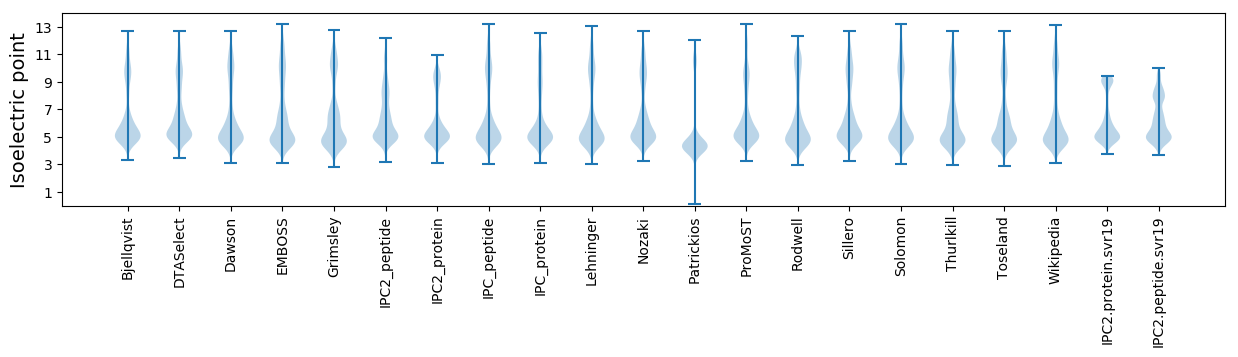
* You can choose from 21 different methods for calculating isoelectric point
Summary statistics related to proteome-wise predictions
Protein with the lowest isoelectric point:
>tr|A0A0T2IH78|A0A0T2IH78_9MICO Uncharacterized protein OS=Phycicoccus sp. Root563 OX=1736562 GN=ASD62_12725 PE=4 SV=1
MM1 pKa = 7.03STQTFDD7 pKa = 3.81VVGMTCGHH15 pKa = 6.75CASAVTEE22 pKa = 4.1EE23 pKa = 4.61LKK25 pKa = 11.2ALDD28 pKa = 4.11GVNDD32 pKa = 3.59VQVALVAGGTSAVTVAADD50 pKa = 4.16RR51 pKa = 11.84EE52 pKa = 4.44LTPAEE57 pKa = 4.17VTSALDD63 pKa = 3.42EE64 pKa = 4.84AGDD67 pKa = 3.74YY68 pKa = 11.29SLAQQ72 pKa = 3.5
MM1 pKa = 7.03STQTFDD7 pKa = 3.81VVGMTCGHH15 pKa = 6.75CASAVTEE22 pKa = 4.1EE23 pKa = 4.61LKK25 pKa = 11.2ALDD28 pKa = 4.11GVNDD32 pKa = 3.59VQVALVAGGTSAVTVAADD50 pKa = 4.16RR51 pKa = 11.84EE52 pKa = 4.44LTPAEE57 pKa = 4.17VTSALDD63 pKa = 3.42EE64 pKa = 4.84AGDD67 pKa = 3.74YY68 pKa = 11.29SLAQQ72 pKa = 3.5
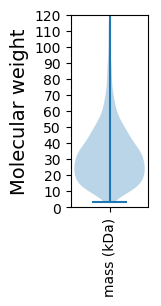
Molecular weight: 7.26 kDa
Isoelectric point according different methods:
Protein with the highest isoelectric point:
>tr|A0A0T2IGS1|A0A0T2IGS1_9MICO 5-dehydro-2-deoxygluconokinase OS=Phycicoccus sp. Root563 OX=1736562 GN=ASD62_11855 PE=4 SV=1
MM1 pKa = 7.69SKK3 pKa = 9.0RR4 pKa = 11.84TFQPNNRR11 pKa = 11.84RR12 pKa = 11.84RR13 pKa = 11.84AKK15 pKa = 8.7THH17 pKa = 5.15GFRR20 pKa = 11.84LRR22 pKa = 11.84MRR24 pKa = 11.84TRR26 pKa = 11.84AGRR29 pKa = 11.84AILSARR35 pKa = 11.84RR36 pKa = 11.84AKK38 pKa = 10.34GRR40 pKa = 11.84SEE42 pKa = 4.21LSAA45 pKa = 4.73
MM1 pKa = 7.69SKK3 pKa = 9.0RR4 pKa = 11.84TFQPNNRR11 pKa = 11.84RR12 pKa = 11.84RR13 pKa = 11.84AKK15 pKa = 8.7THH17 pKa = 5.15GFRR20 pKa = 11.84LRR22 pKa = 11.84MRR24 pKa = 11.84TRR26 pKa = 11.84AGRR29 pKa = 11.84AILSARR35 pKa = 11.84RR36 pKa = 11.84AKK38 pKa = 10.34GRR40 pKa = 11.84SEE42 pKa = 4.21LSAA45 pKa = 4.73
Molecular weight: 5.26 kDa
Isoelectric point according different methods:
Peptides (in silico digests for buttom-up proteomics)
Below you can find in silico digests of the whole proteome with Trypsin, Chymotrypsin, Trypsin+LysC, LysN, ArgC proteases suitable for different mass spec machines.| Try ESI |
 |
|---|
| ChTry ESI |
|
|---|
| ArgC ESI |
|
|---|
| LysN ESI |
|
|---|
| TryLysC ESI |
|
|---|
| Try MALDI |
|
|---|
| ChTry MALDI |
|
|---|
| ArgC MALDI |
|
|---|
| LysN MALDI |
|
|---|
| TryLysC MALDI |
|
|---|
| Try LTQ |
|
|---|
| ChTry LTQ |
|
|---|
| ArgC LTQ |
|
|---|
| LysN LTQ |
|
|---|
| TryLysC LTQ |
|
|---|
| Try MSlow |
|
|---|
| ChTry MSlow |
|
|---|
| ArgC MSlow |
|
|---|
| LysN MSlow |
|
|---|
| TryLysC MSlow |
|
|---|
| Try MShigh |
|
|---|
| ChTry MShigh |
|
|---|
| ArgC MShigh |
|
|---|
| LysN MShigh |
|
|---|
| TryLysC MShigh |
|
|---|
General Statistics
Number of major isoforms |
Number of additional isoforms |
Number of all proteins |
Number of amino acids |
Min. Seq. Length |
Max. Seq. Length |
Avg. Seq. Length |
Avg. Mol. Weight |
|---|---|---|---|---|---|---|---|
0 |
1203151 |
28 |
2259 |
324.0 |
34.5 |
Amino acid frequency
Ala |
Cys |
Asp |
Glu |
Phe |
Gly |
His |
Ile |
Lys |
Leu |
|---|---|---|---|---|---|---|---|---|---|
13.316 ± 0.057 | 0.669 ± 0.011 |
6.208 ± 0.031 | 5.253 ± 0.039 |
2.76 ± 0.023 | 9.443 ± 0.027 |
2.215 ± 0.019 | 3.259 ± 0.028 |
2.124 ± 0.033 | 10.146 ± 0.046 |
Met |
Asn |
Gln |
Pro |
Arg |
Ser |
Thr |
Val |
Trp |
Tyr |
|---|---|---|---|---|---|---|---|---|---|
1.815 ± 0.016 | 1.783 ± 0.022 |
5.57 ± 0.029 | 2.866 ± 0.021 |
7.396 ± 0.042 | 5.636 ± 0.033 |
6.433 ± 0.04 | 9.695 ± 0.039 |
1.543 ± 0.017 | 1.867 ± 0.018 |
Most of the basic statistics you can see at this page can be downloaded from this CSV file
See this proteome in:

Proteome-pI is available under Creative Commons Attribution-NoDerivs license, for more details see here
| Reference: Kozlowski LP. Proteome-pI 2.0: Proteome Isoelectric Point Database Update. Nucleic Acids Res. 2021, doi: 10.1093/nar/gkab944 | Contact: Lukasz P. Kozlowski |