Synechococcus phage S-T4
Taxonomy: Viruses; Duplodnaviria; Heunggongvirae; Uroviricota; Caudoviricetes; Caudovirales; Myoviridae; Tamkungvirus; Synechococcus virus ST4
Average proteome isoelectric point is 5.71
Get precalculated fractions of proteins
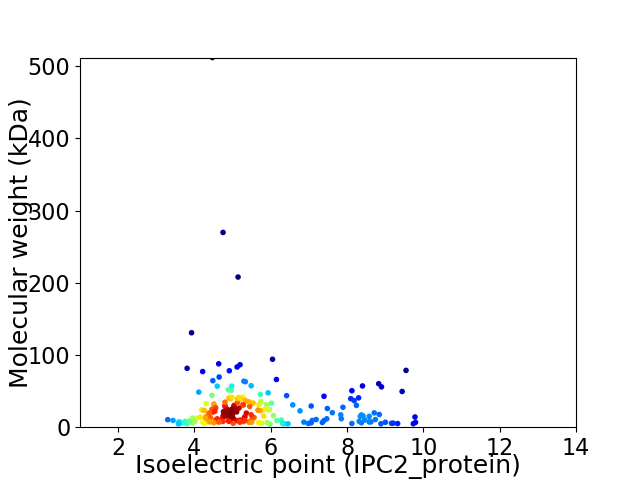
Virtual 2D-PAGE plot for 202 proteins (isoelectric point calculated using IPC2_protein)
Get csv file with sequences according to given criteria:
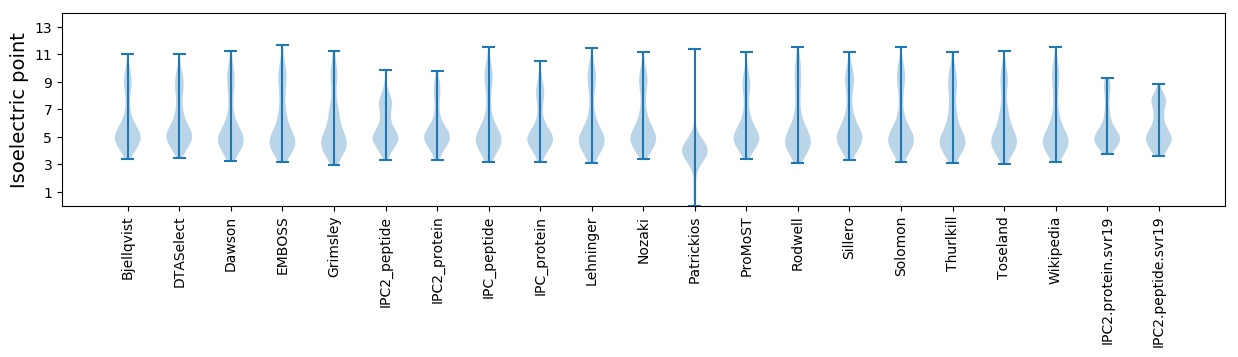
* You can choose from 21 different methods for calculating isoelectric point
Summary statistics related to proteome-wise predictions
Protein with the lowest isoelectric point:
>tr|A0A385EGV6|A0A385EGV6_9CAUD Photosystem II OS=Synechococcus phage S-T4 OX=2268578 PE=3 SV=1
MM1 pKa = 7.66ISDD4 pKa = 3.91ATYY7 pKa = 10.94QDD9 pKa = 4.81WEE11 pKa = 4.49DD12 pKa = 3.13FWYY15 pKa = 10.89NGEE18 pKa = 4.42AEE20 pKa = 4.36QQEE23 pKa = 4.59PMTDD27 pKa = 3.42LSDD30 pKa = 3.27LHH32 pKa = 6.9YY33 pKa = 11.05EE34 pKa = 4.5RR35 pKa = 11.84IAFLEE40 pKa = 4.06SEE42 pKa = 3.93IVKK45 pKa = 9.7YY46 pKa = 9.4QEE48 pKa = 4.67EE49 pKa = 4.14ISLLKK54 pKa = 10.62DD55 pKa = 3.17QIEE58 pKa = 4.54IISNGRR64 pKa = 11.84EE65 pKa = 3.85YY66 pKa = 11.3DD67 pKa = 3.62CC68 pKa = 6.34
MM1 pKa = 7.66ISDD4 pKa = 3.91ATYY7 pKa = 10.94QDD9 pKa = 4.81WEE11 pKa = 4.49DD12 pKa = 3.13FWYY15 pKa = 10.89NGEE18 pKa = 4.42AEE20 pKa = 4.36QQEE23 pKa = 4.59PMTDD27 pKa = 3.42LSDD30 pKa = 3.27LHH32 pKa = 6.9YY33 pKa = 11.05EE34 pKa = 4.5RR35 pKa = 11.84IAFLEE40 pKa = 4.06SEE42 pKa = 3.93IVKK45 pKa = 9.7YY46 pKa = 9.4QEE48 pKa = 4.67EE49 pKa = 4.14ISLLKK54 pKa = 10.62DD55 pKa = 3.17QIEE58 pKa = 4.54IISNGRR64 pKa = 11.84EE65 pKa = 3.85YY66 pKa = 11.3DD67 pKa = 3.62CC68 pKa = 6.34
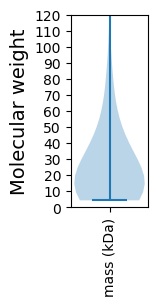
Molecular weight: 8.19 kDa
Isoelectric point according different methods:
Protein with the highest isoelectric point:
>tr|A0A385EGX6|A0A385EGX6_9CAUD Uncharacterized protein OS=Synechococcus phage S-T4 OX=2268578 PE=4 SV=1
MM1 pKa = 7.18VGSASTGFVPNRR13 pKa = 11.84QVPIRR18 pKa = 11.84VEE20 pKa = 3.94LKK22 pKa = 10.87AFFQFVNSFFMNFSQILFKK41 pKa = 11.21VV42 pKa = 3.44
MM1 pKa = 7.18VGSASTGFVPNRR13 pKa = 11.84QVPIRR18 pKa = 11.84VEE20 pKa = 3.94LKK22 pKa = 10.87AFFQFVNSFFMNFSQILFKK41 pKa = 11.21VV42 pKa = 3.44
Molecular weight: 4.83 kDa
Isoelectric point according different methods:
Peptides (in silico digests for buttom-up proteomics)
Below you can find in silico digests of the whole proteome with Trypsin, Chymotrypsin, Trypsin+LysC, LysN, ArgC proteases suitable for different mass spec machines.| Try ESI |
 |
|---|
| ChTry ESI |
|
|---|
| ArgC ESI |
|
|---|
| LysN ESI |
|
|---|
| TryLysC ESI |
|
|---|
| Try MALDI |
|
|---|
| ChTry MALDI |
|
|---|
| ArgC MALDI |
|
|---|
| LysN MALDI |
|
|---|
| TryLysC MALDI |
|
|---|
| Try LTQ |
|
|---|
| ChTry LTQ |
|
|---|
| ArgC LTQ |
|
|---|
| LysN LTQ |
|
|---|
| TryLysC LTQ |
|
|---|
| Try MSlow |
|
|---|
| ChTry MSlow |
|
|---|
| ArgC MSlow |
|
|---|
| LysN MSlow |
|
|---|
| TryLysC MSlow |
|
|---|
| Try MShigh |
|
|---|
| ChTry MShigh |
|
|---|
| ArgC MShigh |
|
|---|
| LysN MShigh |
|
|---|
| TryLysC MShigh |
|
|---|
General Statistics
Number of major isoforms |
Number of additional isoforms |
Number of all proteins |
Number of amino acids |
Min. Seq. Length |
Max. Seq. Length |
Avg. Seq. Length |
Avg. Mol. Weight |
|---|---|---|---|---|---|---|---|
0 |
51871 |
38 |
4749 |
256.8 |
28.67 |
Amino acid frequency
Ala |
Cys |
Asp |
Glu |
Phe |
Gly |
His |
Ile |
Lys |
Leu |
|---|---|---|---|---|---|---|---|---|---|
5.957 ± 0.249 | 0.941 ± 0.091 |
6.628 ± 0.135 | 6.35 ± 0.304 |
4.766 ± 0.13 | 7.684 ± 0.383 |
1.623 ± 0.133 | 6.915 ± 0.217 |
6.053 ± 0.379 | 7.256 ± 0.169 |
Met |
Asn |
Gln |
Pro |
Arg |
Ser |
Thr |
Val |
Trp |
Tyr |
|---|---|---|---|---|---|---|---|---|---|
1.974 ± 0.188 | 5.868 ± 0.16 |
3.946 ± 0.141 | 3.462 ± 0.121 |
4.022 ± 0.133 | 7.361 ± 0.276 |
7.125 ± 0.421 | 6.676 ± 0.227 |
1.134 ± 0.122 | 4.257 ± 0.123 |
Most of the basic statistics you can see at this page can be downloaded from this CSV file
See this proteome in:

Proteome-pI is available under Creative Commons Attribution-NoDerivs license, for more details see here
| Reference: Kozlowski LP. Proteome-pI 2.0: Proteome Isoelectric Point Database Update. Nucleic Acids Res. 2021, doi: 10.1093/nar/gkab944 | Contact: Lukasz P. Kozlowski |