Streptococcus satellite phage Javan731
Taxonomy: Viruses; unclassified bacterial viruses
Average proteome isoelectric point is 6.95
Get precalculated fractions of proteins
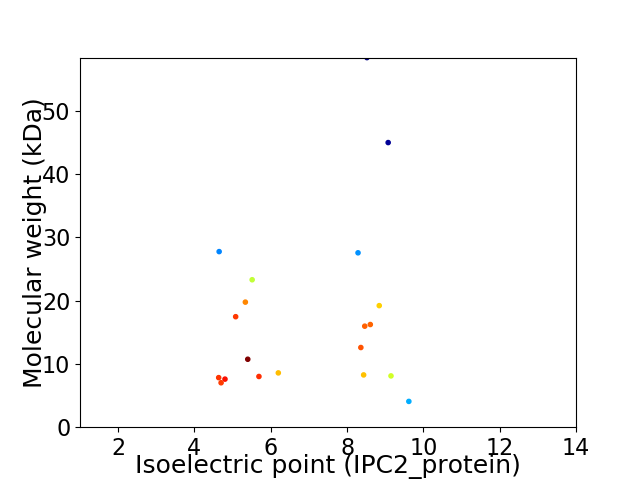
Virtual 2D-PAGE plot for 20 proteins (isoelectric point calculated using IPC2_protein)
Get csv file with sequences according to given criteria:
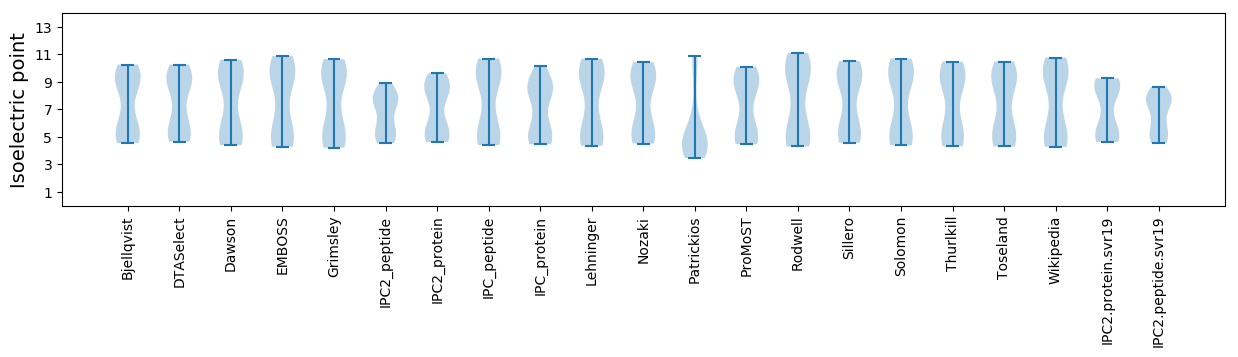
* You can choose from 21 different methods for calculating isoelectric point
Summary statistics related to proteome-wise predictions
Protein with the lowest isoelectric point:
>tr|A0A4D5ZU88|A0A4D5ZU88_9VIRU Uncharacterized protein OS=Streptococcus satellite phage Javan731 OX=2558825 GN=JavanS731_0006 PE=4 SV=1
MM1 pKa = 7.17QVIVDD6 pKa = 3.83DD7 pKa = 3.73WCNRR11 pKa = 11.84GLNEE15 pKa = 4.17YY16 pKa = 7.72EE17 pKa = 3.77TGILYY22 pKa = 9.7FPKK25 pKa = 10.47HH26 pKa = 6.0EE27 pKa = 4.95DD28 pKa = 2.95KK29 pKa = 10.48MDD31 pKa = 4.04YY32 pKa = 10.61IRR34 pKa = 11.84FNKK37 pKa = 9.57GLEE40 pKa = 4.15PLYY43 pKa = 10.66HH44 pKa = 7.02ALDD47 pKa = 3.75EE48 pKa = 5.02PYY50 pKa = 8.07TTISKK55 pKa = 10.43SEE57 pKa = 3.88WLKK60 pKa = 11.29LLDD63 pKa = 3.66
MM1 pKa = 7.17QVIVDD6 pKa = 3.83DD7 pKa = 3.73WCNRR11 pKa = 11.84GLNEE15 pKa = 4.17YY16 pKa = 7.72EE17 pKa = 3.77TGILYY22 pKa = 9.7FPKK25 pKa = 10.47HH26 pKa = 6.0EE27 pKa = 4.95DD28 pKa = 2.95KK29 pKa = 10.48MDD31 pKa = 4.04YY32 pKa = 10.61IRR34 pKa = 11.84FNKK37 pKa = 9.57GLEE40 pKa = 4.15PLYY43 pKa = 10.66HH44 pKa = 7.02ALDD47 pKa = 3.75EE48 pKa = 5.02PYY50 pKa = 8.07TTISKK55 pKa = 10.43SEE57 pKa = 3.88WLKK60 pKa = 11.29LLDD63 pKa = 3.66
Molecular weight: 7.6 kDa
Isoelectric point according different methods:
Protein with the highest isoelectric point:
>tr|A0A4D5ZZ37|A0A4D5ZZ37_9VIRU Transcriptional regulator OS=Streptococcus satellite phage Javan731 OX=2558825 GN=JavanS731_0005 PE=4 SV=1
MM1 pKa = 7.12MPKK4 pKa = 10.19SNYY7 pKa = 9.53RR8 pKa = 11.84EE9 pKa = 3.74MRR11 pKa = 11.84FISSLGEE18 pKa = 3.68KK19 pKa = 10.38LLATRR24 pKa = 11.84ILFTVTIANNQQ35 pKa = 3.18
MM1 pKa = 7.12MPKK4 pKa = 10.19SNYY7 pKa = 9.53RR8 pKa = 11.84EE9 pKa = 3.74MRR11 pKa = 11.84FISSLGEE18 pKa = 3.68KK19 pKa = 10.38LLATRR24 pKa = 11.84ILFTVTIANNQQ35 pKa = 3.18
Molecular weight: 4.07 kDa
Isoelectric point according different methods:
Peptides (in silico digests for buttom-up proteomics)
Below you can find in silico digests of the whole proteome with Trypsin, Chymotrypsin, Trypsin+LysC, LysN, ArgC proteases suitable for different mass spec machines.| Try ESI |
 |
|---|
| ChTry ESI |
|
|---|
| ArgC ESI |
|
|---|
| LysN ESI |
|
|---|
| TryLysC ESI |
|
|---|
| Try MALDI |
|
|---|
| ChTry MALDI |
|
|---|
| ArgC MALDI |
|
|---|
| LysN MALDI |
|
|---|
| TryLysC MALDI |
|
|---|
| Try LTQ |
|
|---|
| ChTry LTQ |
|
|---|
| ArgC LTQ |
|
|---|
| LysN LTQ |
|
|---|
| TryLysC LTQ |
|
|---|
| Try MSlow |
|
|---|
| ChTry MSlow |
|
|---|
| ArgC MSlow |
|
|---|
| LysN MSlow |
|
|---|
| TryLysC MSlow |
|
|---|
| Try MShigh |
|
|---|
| ChTry MShigh |
|
|---|
| ArgC MShigh |
|
|---|
| LysN MShigh |
|
|---|
| TryLysC MShigh |
|
|---|
General Statistics
Number of major isoforms |
Number of additional isoforms |
Number of all proteins |
Number of amino acids |
Min. Seq. Length |
Max. Seq. Length |
Avg. Seq. Length |
Avg. Mol. Weight |
|---|---|---|---|---|---|---|---|
0 |
3056 |
35 |
507 |
152.8 |
17.67 |
Amino acid frequency
Ala |
Cys |
Asp |
Glu |
Phe |
Gly |
His |
Ile |
Lys |
Leu |
|---|---|---|---|---|---|---|---|---|---|
5.726 ± 0.547 | 0.785 ± 0.195 |
5.432 ± 0.283 | 8.213 ± 0.587 |
4.123 ± 0.581 | 4.777 ± 0.453 |
1.898 ± 0.228 | 7.624 ± 0.394 |
9.62 ± 0.527 | 10.242 ± 0.628 |
Met |
Asn |
Gln |
Pro |
Arg |
Ser |
Thr |
Val |
Trp |
Tyr |
|---|---|---|---|---|---|---|---|---|---|
2.421 ± 0.409 | 5.563 ± 0.344 |
3.207 ± 0.371 | 4.188 ± 0.373 |
4.908 ± 0.324 | 5.137 ± 0.393 |
5.694 ± 0.482 | 5.17 ± 0.425 |
0.884 ± 0.182 | 4.385 ± 0.347 |
Most of the basic statistics you can see at this page can be downloaded from this CSV file
See this proteome in:

Proteome-pI is available under Creative Commons Attribution-NoDerivs license, for more details see here
| Reference: Kozlowski LP. Proteome-pI 2.0: Proteome Isoelectric Point Database Update. Nucleic Acids Res. 2021, doi: 10.1093/nar/gkab944 | Contact: Lukasz P. Kozlowski |