Cyanophage PP
Taxonomy: Viruses; Duplodnaviria; Heunggongvirae; Uroviricota; Caudoviricetes; Caudovirales; Podoviridae; Wumptrevirus; Phormidium virus PP
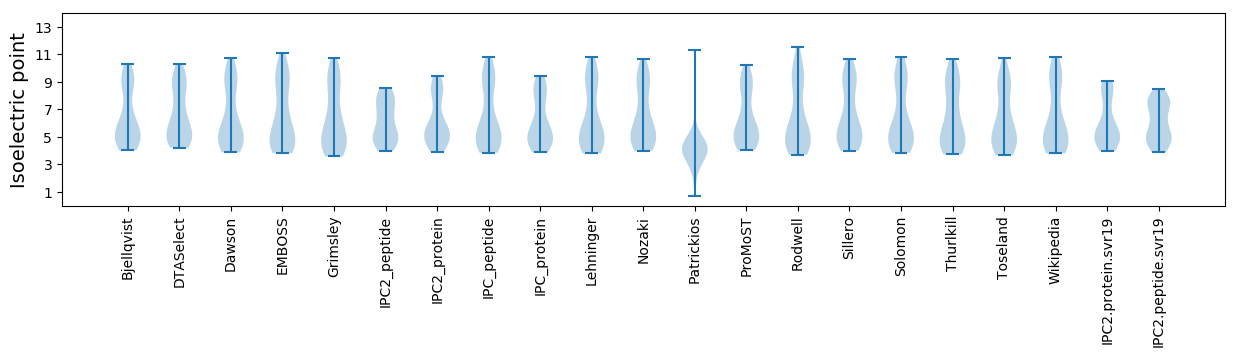
Average proteome isoelectric point is 6.08
Get precalculated fractions of proteins

Virtual 2D-PAGE plot for 41 proteins (isoelectric point calculated using IPC2_protein)
Get csv file with sequences according to given criteria:
* You can choose from 21 different methods for calculating isoelectric point
Summary statistics related to proteome-wise predictions
Protein with the lowest isoelectric point:
>tr|U5PRB0|U5PRB0_9CAUD Uncharacterized protein OS=Cyanophage PP OX=434346 GN=PP_08 PE=4 SV=1
MM1 pKa = 7.24NCIALTLSVLLCRR14 pKa = 11.84QVSPVGVLTATIEE27 pKa = 4.22LYY29 pKa = 10.71EE30 pKa = 4.57PLPQTTLTLDD40 pKa = 3.49EE41 pKa = 4.72CSSRR45 pKa = 11.84SEE47 pKa = 4.27GFTLRR52 pKa = 11.84PDD54 pKa = 3.83SEE56 pKa = 4.36CQEE59 pKa = 4.48LLTTLDD65 pKa = 3.43NTSEE69 pKa = 4.11VAYY72 pKa = 10.52GNTKK76 pKa = 7.89QQQ78 pKa = 2.97
MM1 pKa = 7.24NCIALTLSVLLCRR14 pKa = 11.84QVSPVGVLTATIEE27 pKa = 4.22LYY29 pKa = 10.71EE30 pKa = 4.57PLPQTTLTLDD40 pKa = 3.49EE41 pKa = 4.72CSSRR45 pKa = 11.84SEE47 pKa = 4.27GFTLRR52 pKa = 11.84PDD54 pKa = 3.83SEE56 pKa = 4.36CQEE59 pKa = 4.48LLTTLDD65 pKa = 3.43NTSEE69 pKa = 4.11VAYY72 pKa = 10.52GNTKK76 pKa = 7.89QQQ78 pKa = 2.97
Molecular weight: 8.55 kDa
Isoelectric point according different methods:
Protein with the highest isoelectric point:
>tr|U5PRM8|U5PRM8_9CAUD Terminase OS=Cyanophage PP OX=434346 GN=PP_37 PE=4 SV=1
MM1 pKa = 7.52TLAQLQVTIMDD12 pKa = 4.67DD13 pKa = 3.35KK14 pKa = 11.55QGIAWLISKK23 pKa = 8.54VINGIKK29 pKa = 10.34DD30 pKa = 3.51LLAKK34 pKa = 10.23RR35 pKa = 11.84KK36 pKa = 9.71RR37 pKa = 11.84KK38 pKa = 9.5
MM1 pKa = 7.52TLAQLQVTIMDD12 pKa = 4.67DD13 pKa = 3.35KK14 pKa = 11.55QGIAWLISKK23 pKa = 8.54VINGIKK29 pKa = 10.34DD30 pKa = 3.51LLAKK34 pKa = 10.23RR35 pKa = 11.84KK36 pKa = 9.71RR37 pKa = 11.84KK38 pKa = 9.5
Molecular weight: 4.34 kDa
Isoelectric point according different methods:
Peptides (in silico digests for buttom-up proteomics)
Below you can find in silico digests of the whole proteome with Trypsin, Chymotrypsin, Trypsin+LysC, LysN, ArgC proteases suitable for different mass spec machines.| Try ESI |
 |
|---|
| ChTry ESI |
|
|---|
| ArgC ESI |
|
|---|
| LysN ESI |
|
|---|
| TryLysC ESI |
|
|---|
| Try MALDI |
|
|---|
| ChTry MALDI |
|
|---|
| ArgC MALDI |
|
|---|
| LysN MALDI |
|
|---|
| TryLysC MALDI |
|
|---|
| Try LTQ |
|
|---|
| ChTry LTQ |
|
|---|
| ArgC LTQ |
|
|---|
| LysN LTQ |
|
|---|
| TryLysC LTQ |
|
|---|
| Try MSlow |
|
|---|
| ChTry MSlow |
|
|---|
| ArgC MSlow |
|
|---|
| LysN MSlow |
|
|---|
| TryLysC MSlow |
|
|---|
| Try MShigh |
|
|---|
| ChTry MShigh |
|
|---|
| ArgC MShigh |
|
|---|
| LysN MShigh |
|
|---|
| TryLysC MShigh |
|
|---|
General Statistics
Number of major isoforms |
Number of additional isoforms |
Number of all proteins |
Number of amino acids |
Min. Seq. Length |
Max. Seq. Length |
Avg. Seq. Length |
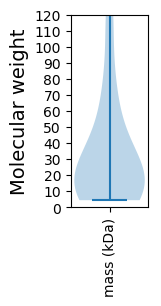
Avg. Mol. Weight |
|---|---|---|---|---|---|---|---|
0 |
13156 |
38 |
1712 |
320.9 |
35.92 |
Amino acid frequency
Ala |
Cys |
Asp |
Glu |
Phe |
Gly |
His |
Ile |
Lys |
Leu |
|---|---|---|---|---|---|---|---|---|---|
7.609 ± 0.366 | 0.699 ± 0.143 |
6.666 ± 0.212 | 5.921 ± 0.426 |
3.39 ± 0.271 | 6.469 ± 0.292 |
1.619 ± 0.247 | 3.443 ± 0.159 |
5.496 ± 0.388 | 9.007 ± 0.193 |
Met |
Asn |
Gln |
Pro |
Arg |
Ser |
Thr |
Val |
Trp |
Tyr |
|---|---|---|---|---|---|---|---|---|---|
1.824 ± 0.175 | 4.5 ± 0.21 |
4.401 ± 0.525 | 5.382 ± 0.558 |
5.777 ± 0.319 | 6.697 ± 0.33 |
7.768 ± 0.51 | 7.806 ± 0.264 |
1.11 ± 0.124 | 4.416 ± 0.37 |
Most of the basic statistics you can see at this page can be downloaded from this CSV file
See this proteome in:

Proteome-pI is available under Creative Commons Attribution-NoDerivs license, for more details see here
| Reference: Kozlowski LP. Proteome-pI 2.0: Proteome Isoelectric Point Database Update. Nucleic Acids Res. 2021, doi: 10.1093/nar/gkab944 | Contact: Lukasz P. Kozlowski |