Streptococcus phage Javan73
Taxonomy: Viruses; Duplodnaviria; Heunggongvirae; Uroviricota; Caudoviricetes; Caudovirales; Siphoviridae; unclassified Siphoviridae
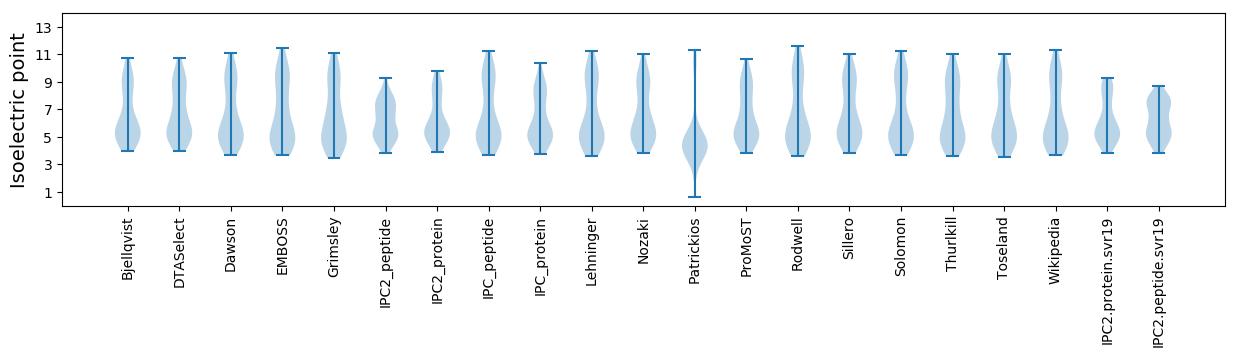
Average proteome isoelectric point is 6.25
Get precalculated fractions of proteins
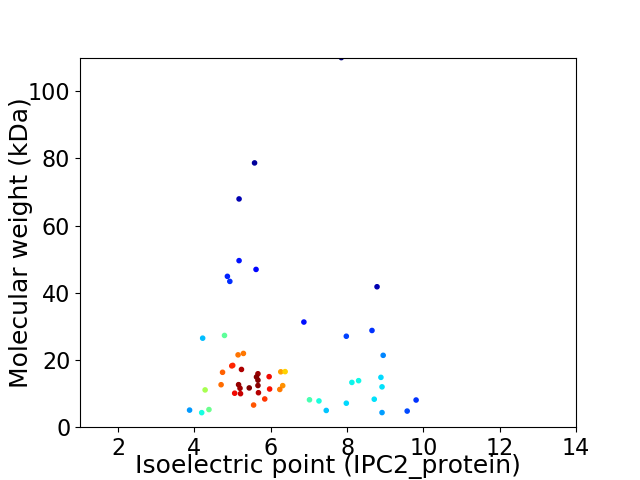
Virtual 2D-PAGE plot for 55 proteins (isoelectric point calculated using IPC2_protein)
Get csv file with sequences according to given criteria:
* You can choose from 21 different methods for calculating isoelectric point
Summary statistics related to proteome-wise predictions
Protein with the lowest isoelectric point:
>tr|A0A4D6AQP2|A0A4D6AQP2_9CAUD Transcriptional regulator OS=Streptococcus phage Javan73 OX=2548304 GN=Javan73_0028 PE=4 SV=1
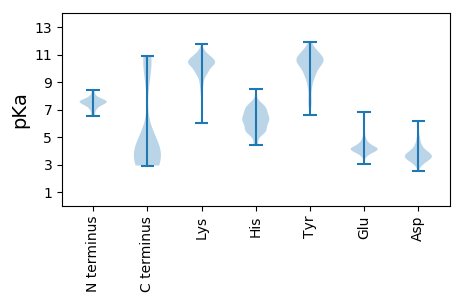
MM1 pKa = 7.06MSKK4 pKa = 10.31FINADD9 pKa = 3.37CLNVMRR15 pKa = 11.84QYY17 pKa = 11.19PDD19 pKa = 4.33DD20 pKa = 4.41YY21 pKa = 11.28FDD23 pKa = 4.78LAIVDD28 pKa = 4.0PPYY31 pKa = 10.69FSGPEE36 pKa = 3.76KK37 pKa = 10.86
MM1 pKa = 7.06MSKK4 pKa = 10.31FINADD9 pKa = 3.37CLNVMRR15 pKa = 11.84QYY17 pKa = 11.19PDD19 pKa = 4.33DD20 pKa = 4.41YY21 pKa = 11.28FDD23 pKa = 4.78LAIVDD28 pKa = 4.0PPYY31 pKa = 10.69FSGPEE36 pKa = 3.76KK37 pKa = 10.86
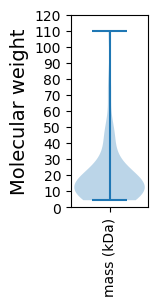
Molecular weight: 4.33 kDa
Isoelectric point according different methods:
Protein with the highest isoelectric point:
>tr|A0A4D6ALW7|A0A4D6ALW7_9CAUD Uncharacterized protein OS=Streptococcus phage Javan73 OX=2548304 GN=Javan73_0024 PE=4 SV=1
MM1 pKa = 7.57NNLQIIAVGTIVSVVLIEE19 pKa = 4.02SLIMNVKK26 pKa = 9.89LKK28 pKa = 10.57KK29 pKa = 10.19ALRR32 pKa = 11.84AKK34 pKa = 10.37KK35 pKa = 8.38STRR38 pKa = 11.84TVMTHH43 pKa = 6.66PAAQRR48 pKa = 11.84GLIDD52 pKa = 3.69YY53 pKa = 7.52KK54 pKa = 9.7TGRR57 pKa = 11.84RR58 pKa = 11.84VDD60 pKa = 3.57INPKK64 pKa = 6.32TRR66 pKa = 11.84KK67 pKa = 9.24EE68 pKa = 4.27VFVDD72 pKa = 3.68
MM1 pKa = 7.57NNLQIIAVGTIVSVVLIEE19 pKa = 4.02SLIMNVKK26 pKa = 9.89LKK28 pKa = 10.57KK29 pKa = 10.19ALRR32 pKa = 11.84AKK34 pKa = 10.37KK35 pKa = 8.38STRR38 pKa = 11.84TVMTHH43 pKa = 6.66PAAQRR48 pKa = 11.84GLIDD52 pKa = 3.69YY53 pKa = 7.52KK54 pKa = 9.7TGRR57 pKa = 11.84RR58 pKa = 11.84VDD60 pKa = 3.57INPKK64 pKa = 6.32TRR66 pKa = 11.84KK67 pKa = 9.24EE68 pKa = 4.27VFVDD72 pKa = 3.68
Molecular weight: 8.09 kDa
Isoelectric point according different methods:
Peptides (in silico digests for buttom-up proteomics)
Below you can find in silico digests of the whole proteome with Trypsin, Chymotrypsin, Trypsin+LysC, LysN, ArgC proteases suitable for different mass spec machines.| Try ESI |
 |
|---|
| ChTry ESI |
|
|---|
| ArgC ESI |
|
|---|
| LysN ESI |
|
|---|
| TryLysC ESI |
|
|---|
| Try MALDI |
|
|---|
| ChTry MALDI |
|
|---|
| ArgC MALDI |
|
|---|
| LysN MALDI |
|
|---|
| TryLysC MALDI |
|
|---|
| Try LTQ |
|
|---|
| ChTry LTQ |
|
|---|
| ArgC LTQ |
|
|---|
| LysN LTQ |
|
|---|
| TryLysC LTQ |
|
|---|
| Try MSlow |
|
|---|
| ChTry MSlow |
|
|---|
| ArgC MSlow |
|
|---|
| LysN MSlow |
|
|---|
| TryLysC MSlow |
|
|---|
| Try MShigh |
|
|---|
| ChTry MShigh |
|
|---|
| ArgC MShigh |
|
|---|
| LysN MShigh |
|
|---|
| TryLysC MShigh |
|
|---|
General Statistics
Number of major isoforms |
Number of additional isoforms |
Number of all proteins |
Number of amino acids |
Min. Seq. Length |
Max. Seq. Length |
Avg. Seq. Length |
Avg. Mol. Weight |
|---|---|---|---|---|---|---|---|
0 |
9902 |
37 |
1022 |
180.0 |
20.49 |
Amino acid frequency
Ala |
Cys |
Asp |
Glu |
Phe |
Gly |
His |
Ile |
Lys |
Leu |
|---|---|---|---|---|---|---|---|---|---|
6.332 ± 0.421 | 0.606 ± 0.116 |
6.14 ± 0.395 | 7.726 ± 0.472 |
4.383 ± 0.311 | 5.878 ± 0.31 |
1.606 ± 0.18 | 7.544 ± 0.439 |
8.534 ± 0.382 | 8.574 ± 0.276 |
Met |
Asn |
Gln |
Pro |
Arg |
Ser |
Thr |
Val |
Trp |
Tyr |
|---|---|---|---|---|---|---|---|---|---|
2.797 ± 0.217 | 6.13 ± 0.257 |
2.646 ± 0.153 | 3.979 ± 0.157 |
4.08 ± 0.324 | 6.08 ± 0.371 |
5.898 ± 0.378 | 6.11 ± 0.236 |
1.131 ± 0.16 | 3.828 ± 0.334 |
Most of the basic statistics you can see at this page can be downloaded from this CSV file
See this proteome in:

Proteome-pI is available under Creative Commons Attribution-NoDerivs license, for more details see here
| Reference: Kozlowski LP. Proteome-pI 2.0: Proteome Isoelectric Point Database Update. Nucleic Acids Res. 2021, doi: 10.1093/nar/gkab944 | Contact: Lukasz P. Kozlowski |