Roseobacter phage CRP-4
Taxonomy: Viruses; Duplodnaviria; Heunggongvirae; Uroviricota; Caudoviricetes; Caudovirales; Zobellviridae; Cobavirinae; Siovirus; unclassified Siovirus
Average proteome isoelectric point is 5.95
Get precalculated fractions of proteins
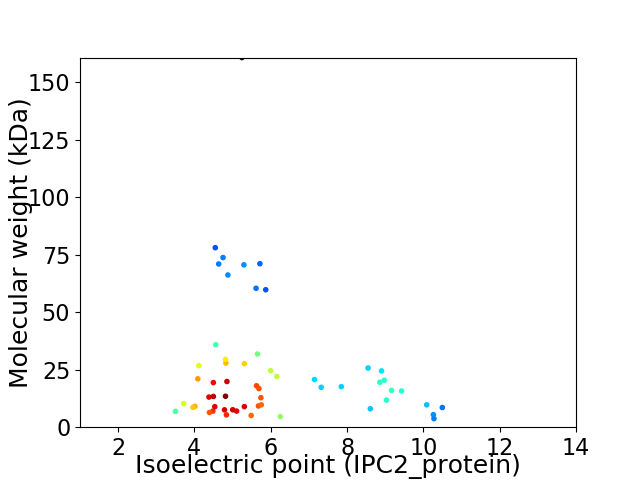
Virtual 2D-PAGE plot for 57 proteins (isoelectric point calculated using IPC2_protein)
Get csv file with sequences according to given criteria:
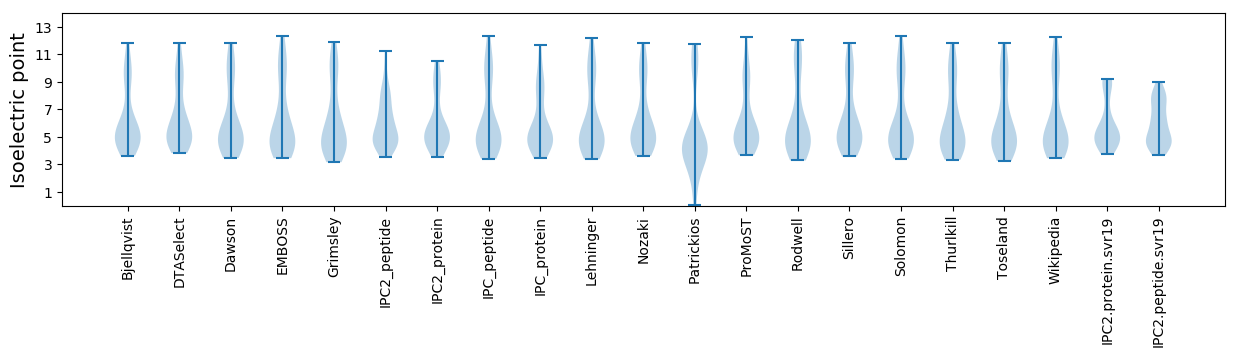
* You can choose from 21 different methods for calculating isoelectric point
Summary statistics related to proteome-wise predictions
Protein with the lowest isoelectric point:
>tr|A0A646QW78|A0A646QW78_9CAUD GNAT family N-acetyltransferase OS=Roseobacter phage CRP-4 OX=2559283 GN=CRP4_gp41 PE=4 SV=1
MM1 pKa = 7.72AKK3 pKa = 9.87QPVVNTISSGYY14 pKa = 10.56ASQSQLNEE22 pKa = 3.82NFSNIQTSFNNTLSLDD38 pKa = 3.56GSTPNAMQANIDD50 pKa = 3.94MNNNDD55 pKa = 4.58IINVSGIYY63 pKa = 10.1VGGVNVLNVLDD74 pKa = 4.09NVTVSTAYY82 pKa = 9.85PSGGNDD88 pKa = 2.78GDD90 pKa = 3.0IWFRR94 pKa = 11.84VSSS97 pKa = 3.69
MM1 pKa = 7.72AKK3 pKa = 9.87QPVVNTISSGYY14 pKa = 10.56ASQSQLNEE22 pKa = 3.82NFSNIQTSFNNTLSLDD38 pKa = 3.56GSTPNAMQANIDD50 pKa = 3.94MNNNDD55 pKa = 4.58IINVSGIYY63 pKa = 10.1VGGVNVLNVLDD74 pKa = 4.09NVTVSTAYY82 pKa = 9.85PSGGNDD88 pKa = 2.78GDD90 pKa = 3.0IWFRR94 pKa = 11.84VSSS97 pKa = 3.69
Molecular weight: 10.29 kDa
Isoelectric point according different methods:
Protein with the highest isoelectric point:
>tr|A0A646QW51|A0A646QW51_9CAUD Nucleotide pyrophosphohydrolase domain protein OS=Roseobacter phage CRP-4 OX=2559283 GN=CRP4_gp22 PE=4 SV=1
MM1 pKa = 8.0AKK3 pKa = 10.24GLYY6 pKa = 10.56ANIHH10 pKa = 6.09AKK12 pKa = 9.73RR13 pKa = 11.84KK14 pKa = 9.62RR15 pKa = 11.84IASGSGEE22 pKa = 4.13KK23 pKa = 9.01MRR25 pKa = 11.84KK26 pKa = 9.05VGSKK30 pKa = 10.07GAPTAKK36 pKa = 10.1NFKK39 pKa = 9.29EE40 pKa = 3.84ASKK43 pKa = 9.02TAKK46 pKa = 9.64KK47 pKa = 9.98RR48 pKa = 11.84KK49 pKa = 9.05KK50 pKa = 10.23
MM1 pKa = 8.0AKK3 pKa = 10.24GLYY6 pKa = 10.56ANIHH10 pKa = 6.09AKK12 pKa = 9.73RR13 pKa = 11.84KK14 pKa = 9.62RR15 pKa = 11.84IASGSGEE22 pKa = 4.13KK23 pKa = 9.01MRR25 pKa = 11.84KK26 pKa = 9.05VGSKK30 pKa = 10.07GAPTAKK36 pKa = 10.1NFKK39 pKa = 9.29EE40 pKa = 3.84ASKK43 pKa = 9.02TAKK46 pKa = 9.64KK47 pKa = 9.98RR48 pKa = 11.84KK49 pKa = 9.05KK50 pKa = 10.23
Molecular weight: 5.45 kDa
Isoelectric point according different methods:
Peptides (in silico digests for buttom-up proteomics)
Below you can find in silico digests of the whole proteome with Trypsin, Chymotrypsin, Trypsin+LysC, LysN, ArgC proteases suitable for different mass spec machines.| Try ESI |
 |
|---|
| ChTry ESI |
|
|---|
| ArgC ESI |
|
|---|
| LysN ESI |
|
|---|
| TryLysC ESI |
|
|---|
| Try MALDI |
|
|---|
| ChTry MALDI |
|
|---|
| ArgC MALDI |
|
|---|
| LysN MALDI |
|
|---|
| TryLysC MALDI |
|
|---|
| Try LTQ |
|
|---|
| ChTry LTQ |
|
|---|
| ArgC LTQ |
|
|---|
| LysN LTQ |
|
|---|
| TryLysC LTQ |
|
|---|
| Try MSlow |
|
|---|
| ChTry MSlow |
|
|---|
| ArgC MSlow |
|
|---|
| LysN MSlow |
|
|---|
| TryLysC MSlow |
|
|---|
| Try MShigh |
|
|---|
| ChTry MShigh |
|
|---|
| ArgC MShigh |
|
|---|
| LysN MShigh |
|
|---|
| TryLysC MShigh |
|
|---|
General Statistics
Number of major isoforms |
Number of additional isoforms |
Number of all proteins |
Number of amino acids |
Min. Seq. Length |
Max. Seq. Length |
Avg. Seq. Length |
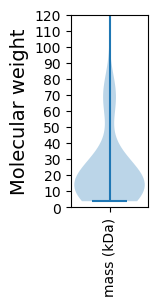
Avg. Mol. Weight |
|---|---|---|---|---|---|---|---|
0 |
12865 |
33 |
1455 |
225.7 |
25.14 |
Amino acid frequency
Ala |
Cys |
Asp |
Glu |
Phe |
Gly |
His |
Ile |
Lys |
Leu |
|---|---|---|---|---|---|---|---|---|---|
8.426 ± 0.458 | 0.731 ± 0.168 |
6.436 ± 0.28 | 6.91 ± 0.323 |
4.073 ± 0.158 | 7.221 ± 0.373 |
1.508 ± 0.179 | 5.387 ± 0.254 |
6.654 ± 0.468 | 7.501 ± 0.308 |
Met |
Asn |
Gln |
Pro |
Arg |
Ser |
Thr |
Val |
Trp |
Tyr |
|---|---|---|---|---|---|---|---|---|---|
2.728 ± 0.161 | 4.975 ± 0.224 |
3.428 ± 0.136 | 3.723 ± 0.256 |
4.78 ± 0.243 | 7.058 ± 0.324 |
6.902 ± 0.371 | 6.623 ± 0.204 |
1.547 ± 0.161 | 3.389 ± 0.158 |
Most of the basic statistics you can see at this page can be downloaded from this CSV file
See this proteome in:

Proteome-pI is available under Creative Commons Attribution-NoDerivs license, for more details see here
| Reference: Kozlowski LP. Proteome-pI 2.0: Proteome Isoelectric Point Database Update. Nucleic Acids Res. 2021, doi: 10.1093/nar/gkab944 | Contact: Lukasz P. Kozlowski |