Salmonella phage SI22
Taxonomy: Viruses; Duplodnaviria; Heunggongvirae; Uroviricota; Caudoviricetes; Caudovirales; Myoviridae; Peduovirinae; Eganvirus; unclassified Eganvirus
Average proteome isoelectric point is 6.48
Get precalculated fractions of proteins
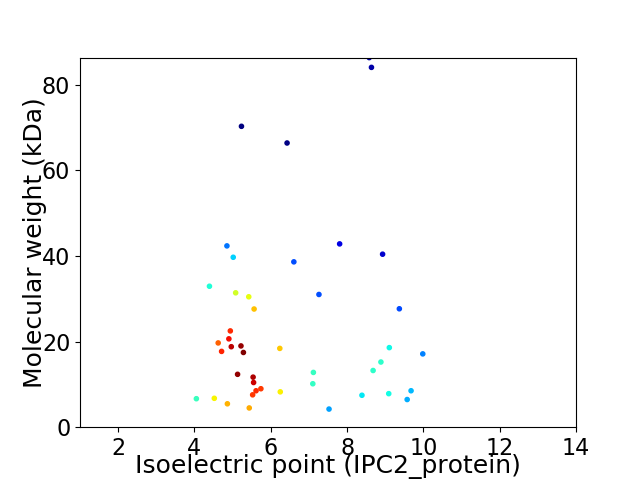
Virtual 2D-PAGE plot for 45 proteins (isoelectric point calculated using IPC2_protein)
Get csv file with sequences according to given criteria:
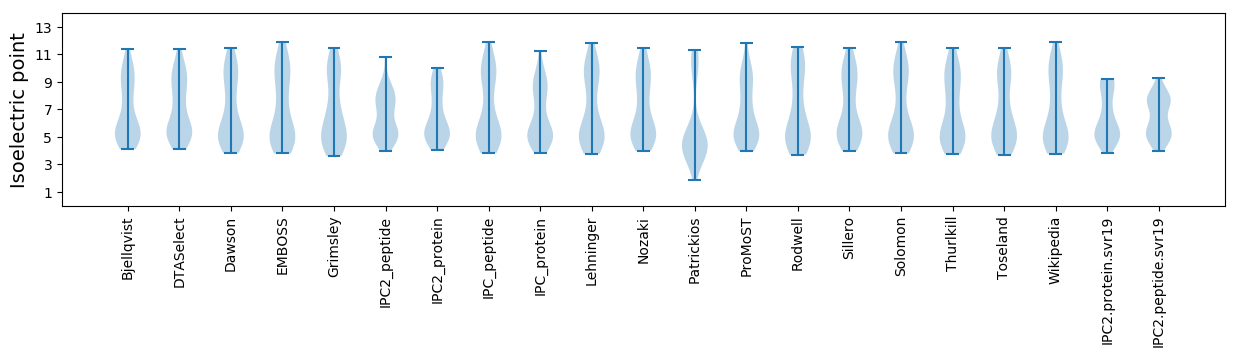
* You can choose from 21 different methods for calculating isoelectric point
Summary statistics related to proteome-wise predictions
Protein with the lowest isoelectric point:
>tr|A0A5C0CGZ3|A0A5C0CGZ3_9CAUD Tail protein OS=Salmonella phage SI22 OX=2592209 PE=4 SV=1
MM1 pKa = 7.4QGDD4 pKa = 4.08TLDD7 pKa = 4.24VICARR12 pKa = 11.84YY13 pKa = 9.04YY14 pKa = 10.75GRR16 pKa = 11.84TEE18 pKa = 4.12GVVEE22 pKa = 4.42TVLQANPGLSEE33 pKa = 4.6LGVILPHH40 pKa = 6.21GTAIDD45 pKa = 4.16LPDD48 pKa = 3.87VPSSPVTEE56 pKa = 4.95TINLWEE62 pKa = 4.05
MM1 pKa = 7.4QGDD4 pKa = 4.08TLDD7 pKa = 4.24VICARR12 pKa = 11.84YY13 pKa = 9.04YY14 pKa = 10.75GRR16 pKa = 11.84TEE18 pKa = 4.12GVVEE22 pKa = 4.42TVLQANPGLSEE33 pKa = 4.6LGVILPHH40 pKa = 6.21GTAIDD45 pKa = 4.16LPDD48 pKa = 3.87VPSSPVTEE56 pKa = 4.95TINLWEE62 pKa = 4.05
Molecular weight: 6.65 kDa
Isoelectric point according different methods:
Protein with the highest isoelectric point:
>tr|A0A5C0CH54|A0A5C0CH54_9CAUD DUF2724 domain-containing protein OS=Salmonella phage SI22 OX=2592209 PE=4 SV=1
MM1 pKa = 6.76TTLDD5 pKa = 4.14PRR7 pKa = 11.84QLWRR11 pKa = 11.84RR12 pKa = 11.84TARR15 pKa = 11.84TGKK18 pKa = 10.2SDD20 pKa = 3.01ACKK23 pKa = 10.13TMHH26 pKa = 7.22LLHH29 pKa = 7.04ARR31 pKa = 11.84LKK33 pKa = 9.09NGKK36 pKa = 8.57FAEE39 pKa = 4.39EE40 pKa = 3.84WHH42 pKa = 6.75KK43 pKa = 10.64KK44 pKa = 7.85TGIHH48 pKa = 6.53GAGLNQVYY56 pKa = 10.25
MM1 pKa = 6.76TTLDD5 pKa = 4.14PRR7 pKa = 11.84QLWRR11 pKa = 11.84RR12 pKa = 11.84TARR15 pKa = 11.84TGKK18 pKa = 10.2SDD20 pKa = 3.01ACKK23 pKa = 10.13TMHH26 pKa = 7.22LLHH29 pKa = 7.04ARR31 pKa = 11.84LKK33 pKa = 9.09NGKK36 pKa = 8.57FAEE39 pKa = 4.39EE40 pKa = 3.84WHH42 pKa = 6.75KK43 pKa = 10.64KK44 pKa = 7.85TGIHH48 pKa = 6.53GAGLNQVYY56 pKa = 10.25
Molecular weight: 6.46 kDa
Isoelectric point according different methods:
Peptides (in silico digests for buttom-up proteomics)
Below you can find in silico digests of the whole proteome with Trypsin, Chymotrypsin, Trypsin+LysC, LysN, ArgC proteases suitable for different mass spec machines.| Try ESI |
 |
|---|
| ChTry ESI |
|
|---|
| ArgC ESI |
|
|---|
| LysN ESI |
|
|---|
| TryLysC ESI |
|
|---|
| Try MALDI |
|
|---|
| ChTry MALDI |
|
|---|
| ArgC MALDI |
|
|---|
| LysN MALDI |
|
|---|
| TryLysC MALDI |
|
|---|
| Try LTQ |
|
|---|
| ChTry LTQ |
|
|---|
| ArgC LTQ |
|
|---|
| LysN LTQ |
|
|---|
| TryLysC LTQ |
|
|---|
| Try MSlow |
|
|---|
| ChTry MSlow |
|
|---|
| ArgC MSlow |
|
|---|
| LysN MSlow |
|
|---|
| TryLysC MSlow |
|
|---|
| Try MShigh |
|
|---|
| ChTry MShigh |
|
|---|
| ArgC MShigh |
|
|---|
| LysN MShigh |
|
|---|
| TryLysC MShigh |
|
|---|
General Statistics
Number of major isoforms |
Number of additional isoforms |
Number of all proteins |
Number of amino acids |
Min. Seq. Length |
Max. Seq. Length |
Avg. Seq. Length |
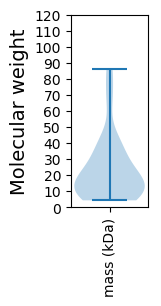
Avg. Mol. Weight |
|---|---|---|---|---|---|---|---|
0 |
9566 |
39 |
814 |
212.6 |
23.52 |
Amino acid frequency
Ala |
Cys |
Asp |
Glu |
Phe |
Gly |
His |
Ile |
Lys |
Leu |
|---|---|---|---|---|---|---|---|---|---|
10.391 ± 0.513 | 0.972 ± 0.137 |
6.251 ± 0.238 | 5.969 ± 0.337 |
3.084 ± 0.259 | 6.941 ± 0.46 |
1.955 ± 0.225 | 5.415 ± 0.195 |
5.614 ± 0.307 | 9.168 ± 0.279 |
Met |
Asn |
Gln |
Pro |
Arg |
Ser |
Thr |
Val |
Trp |
Tyr |
|---|---|---|---|---|---|---|---|---|---|
2.519 ± 0.158 | 4.077 ± 0.222 |
4.087 ± 0.241 | 3.805 ± 0.316 |
6.293 ± 0.451 | 6.23 ± 0.255 |
6.324 ± 0.326 | 6.586 ± 0.33 |
1.662 ± 0.165 | 2.655 ± 0.2 |
Most of the basic statistics you can see at this page can be downloaded from this CSV file
See this proteome in:

Proteome-pI is available under Creative Commons Attribution-NoDerivs license, for more details see here
| Reference: Kozlowski LP. Proteome-pI 2.0: Proteome Isoelectric Point Database Update. Nucleic Acids Res. 2021, doi: 10.1093/nar/gkab944 | Contact: Lukasz P. Kozlowski |