Pedobacter nyackensis
Taxonomy: cellular organisms; Bacteria; FCB group; Bacteroidetes/Chlorobi group; Bacteroidetes; Sphingobacteriia; Sphingobacteriales; Sphingobacteriaceae; Pedobacter
Average proteome isoelectric point is 6.97
Get precalculated fractions of proteins
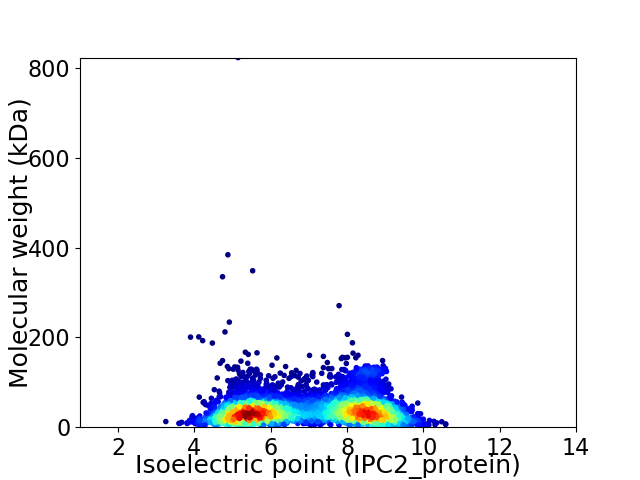
Virtual 2D-PAGE plot for 4961 proteins (isoelectric point calculated using IPC2_protein)
Get csv file with sequences according to given criteria:
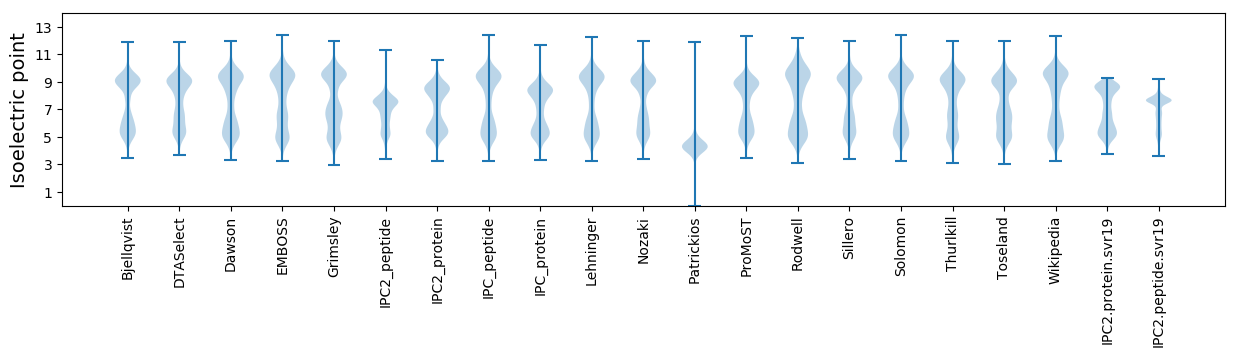
* You can choose from 21 different methods for calculating isoelectric point
Summary statistics related to proteome-wise predictions
Protein with the lowest isoelectric point:
>tr|A0A1W2D255|A0A1W2D255_9SPHI Uncharacterized protein OS=Pedobacter nyackensis OX=475255 GN=SAMN04488101_105192 PE=4 SV=1
MM1 pKa = 7.69EE2 pKa = 5.66DD3 pKa = 3.77AIKK6 pKa = 10.93GLVPHH11 pKa = 6.37VLSFIVSEE19 pKa = 4.16FCKK22 pKa = 10.69YY23 pKa = 10.7GFLIAYY29 pKa = 7.55EE30 pKa = 4.59KK31 pKa = 10.92DD32 pKa = 3.32LSDD35 pKa = 3.87LKK37 pKa = 11.43GLIEE41 pKa = 4.91PDD43 pKa = 3.85SISAEE48 pKa = 3.91DD49 pKa = 4.2FEE51 pKa = 5.61LLEE54 pKa = 4.65AVDD57 pKa = 4.69DD58 pKa = 4.29PVVQLLLRR66 pKa = 11.84SIDD69 pKa = 3.59KK70 pKa = 10.54VVNCSKK76 pKa = 10.07TYY78 pKa = 10.86FMINNLDD85 pKa = 3.7EE86 pKa = 4.8YY87 pKa = 10.83EE88 pKa = 4.16VMEE91 pKa = 4.29NEE93 pKa = 5.15EE94 pKa = 4.26YY95 pKa = 10.89NQLASDD101 pKa = 3.89NYY103 pKa = 10.3YY104 pKa = 10.19IYY106 pKa = 10.43IIDD109 pKa = 4.14WEE111 pKa = 4.35NKK113 pKa = 8.15TYY115 pKa = 10.97EE116 pKa = 4.49DD117 pKa = 5.3LLINLNAVYY126 pKa = 7.93FTIARR131 pKa = 11.84LLYY134 pKa = 10.32HH135 pKa = 7.32CATQIRR141 pKa = 11.84RR142 pKa = 11.84NEE144 pKa = 3.76IEE146 pKa = 4.95LPDD149 pKa = 3.98EE150 pKa = 4.82FYY152 pKa = 11.27DD153 pKa = 5.92DD154 pKa = 4.85EE155 pKa = 5.7FLDD158 pKa = 4.65HH159 pKa = 6.99YY160 pKa = 11.73NEE162 pKa = 4.12LLDD165 pKa = 5.37RR166 pKa = 11.84KK167 pKa = 9.99LQSEE171 pKa = 4.69DD172 pKa = 3.4KK173 pKa = 10.88NVALLYY179 pKa = 10.79DD180 pKa = 5.11LIADD184 pKa = 4.84LNLDD188 pKa = 4.77LYY190 pKa = 11.28DD191 pKa = 4.69IDD193 pKa = 4.04QLSS196 pKa = 3.06
MM1 pKa = 7.69EE2 pKa = 5.66DD3 pKa = 3.77AIKK6 pKa = 10.93GLVPHH11 pKa = 6.37VLSFIVSEE19 pKa = 4.16FCKK22 pKa = 10.69YY23 pKa = 10.7GFLIAYY29 pKa = 7.55EE30 pKa = 4.59KK31 pKa = 10.92DD32 pKa = 3.32LSDD35 pKa = 3.87LKK37 pKa = 11.43GLIEE41 pKa = 4.91PDD43 pKa = 3.85SISAEE48 pKa = 3.91DD49 pKa = 4.2FEE51 pKa = 5.61LLEE54 pKa = 4.65AVDD57 pKa = 4.69DD58 pKa = 4.29PVVQLLLRR66 pKa = 11.84SIDD69 pKa = 3.59KK70 pKa = 10.54VVNCSKK76 pKa = 10.07TYY78 pKa = 10.86FMINNLDD85 pKa = 3.7EE86 pKa = 4.8YY87 pKa = 10.83EE88 pKa = 4.16VMEE91 pKa = 4.29NEE93 pKa = 5.15EE94 pKa = 4.26YY95 pKa = 10.89NQLASDD101 pKa = 3.89NYY103 pKa = 10.3YY104 pKa = 10.19IYY106 pKa = 10.43IIDD109 pKa = 4.14WEE111 pKa = 4.35NKK113 pKa = 8.15TYY115 pKa = 10.97EE116 pKa = 4.49DD117 pKa = 5.3LLINLNAVYY126 pKa = 7.93FTIARR131 pKa = 11.84LLYY134 pKa = 10.32HH135 pKa = 7.32CATQIRR141 pKa = 11.84RR142 pKa = 11.84NEE144 pKa = 3.76IEE146 pKa = 4.95LPDD149 pKa = 3.98EE150 pKa = 4.82FYY152 pKa = 11.27DD153 pKa = 5.92DD154 pKa = 4.85EE155 pKa = 5.7FLDD158 pKa = 4.65HH159 pKa = 6.99YY160 pKa = 11.73NEE162 pKa = 4.12LLDD165 pKa = 5.37RR166 pKa = 11.84KK167 pKa = 9.99LQSEE171 pKa = 4.69DD172 pKa = 3.4KK173 pKa = 10.88NVALLYY179 pKa = 10.79DD180 pKa = 5.11LIADD184 pKa = 4.84LNLDD188 pKa = 4.77LYY190 pKa = 11.28DD191 pKa = 4.69IDD193 pKa = 4.04QLSS196 pKa = 3.06
Molecular weight: 23.07 kDa
Isoelectric point according different methods:
Protein with the highest isoelectric point:
>tr|A0A1W2F517|A0A1W2F517_9SPHI AraC-type DNA-binding protein OS=Pedobacter nyackensis OX=475255 GN=SAMN04488101_12137 PE=4 SV=1
MM1 pKa = 7.35VDD3 pKa = 3.21KK4 pKa = 10.44FFSISYY10 pKa = 8.96SSCSKK15 pKa = 9.88EE16 pKa = 3.76RR17 pKa = 11.84RR18 pKa = 11.84SNAFLIATRR27 pKa = 11.84GKK29 pKa = 10.05RR30 pKa = 11.84VVNHH34 pKa = 6.61LIGRR38 pKa = 11.84ITAGMGHH45 pKa = 7.03HH46 pKa = 7.42DD47 pKa = 3.92FLFFDD52 pKa = 3.67RR53 pKa = 11.84RR54 pKa = 11.84KK55 pKa = 10.09NFPIKK60 pKa = 10.06VRR62 pKa = 11.84KK63 pKa = 9.43PNDD66 pKa = 3.11TDD68 pKa = 3.18
MM1 pKa = 7.35VDD3 pKa = 3.21KK4 pKa = 10.44FFSISYY10 pKa = 8.96SSCSKK15 pKa = 9.88EE16 pKa = 3.76RR17 pKa = 11.84RR18 pKa = 11.84SNAFLIATRR27 pKa = 11.84GKK29 pKa = 10.05RR30 pKa = 11.84VVNHH34 pKa = 6.61LIGRR38 pKa = 11.84ITAGMGHH45 pKa = 7.03HH46 pKa = 7.42DD47 pKa = 3.92FLFFDD52 pKa = 3.67RR53 pKa = 11.84RR54 pKa = 11.84KK55 pKa = 10.09NFPIKK60 pKa = 10.06VRR62 pKa = 11.84KK63 pKa = 9.43PNDD66 pKa = 3.11TDD68 pKa = 3.18
Molecular weight: 7.93 kDa
Isoelectric point according different methods:
Peptides (in silico digests for buttom-up proteomics)
Below you can find in silico digests of the whole proteome with Trypsin, Chymotrypsin, Trypsin+LysC, LysN, ArgC proteases suitable for different mass spec machines.| Try ESI |
 |
|---|
| ChTry ESI |
|
|---|
| ArgC ESI |
|
|---|
| LysN ESI |
|
|---|
| TryLysC ESI |
|
|---|
| Try MALDI |
|
|---|
| ChTry MALDI |
|
|---|
| ArgC MALDI |
|
|---|
| LysN MALDI |
|
|---|
| TryLysC MALDI |
|
|---|
| Try LTQ |
|
|---|
| ChTry LTQ |
|
|---|
| ArgC LTQ |
|
|---|
| LysN LTQ |
|
|---|
| TryLysC LTQ |
|
|---|
| Try MSlow |
|
|---|
| ChTry MSlow |
|
|---|
| ArgC MSlow |
|
|---|
| LysN MSlow |
|
|---|
| TryLysC MSlow |
|
|---|
| Try MShigh |
|
|---|
| ChTry MShigh |
|
|---|
| ArgC MShigh |
|
|---|
| LysN MShigh |
|
|---|
| TryLysC MShigh |
|
|---|
General Statistics
Number of major isoforms |
Number of additional isoforms |
Number of all proteins |
Number of amino acids |
Min. Seq. Length |
Max. Seq. Length |
Avg. Seq. Length |
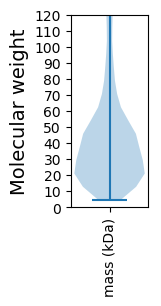
Avg. Mol. Weight |
|---|---|---|---|---|---|---|---|
0 |
1862186 |
39 |
7858 |
375.4 |
42.02 |
Amino acid frequency
Ala |
Cys |
Asp |
Glu |
Phe |
Gly |
His |
Ile |
Lys |
Leu |
|---|---|---|---|---|---|---|---|---|---|
7.401 ± 0.032 | 0.743 ± 0.01 |
5.306 ± 0.02 | 5.596 ± 0.037 |
4.847 ± 0.022 | 7.01 ± 0.04 |
1.686 ± 0.019 | 7.174 ± 0.033 |
7.34 ± 0.039 | 9.385 ± 0.035 |
Met |
Asn |
Gln |
Pro |
Arg |
Ser |
Thr |
Val |
Trp |
Tyr |
|---|---|---|---|---|---|---|---|---|---|
2.299 ± 0.017 | 5.966 ± 0.035 |
3.771 ± 0.021 | 3.541 ± 0.018 |
3.771 ± 0.02 | 6.527 ± 0.03 |
5.887 ± 0.048 | 6.349 ± 0.021 |
1.204 ± 0.012 | 4.199 ± 0.022 |
Most of the basic statistics you can see at this page can be downloaded from this CSV file
See this proteome in:

Proteome-pI is available under Creative Commons Attribution-NoDerivs license, for more details see here
| Reference: Kozlowski LP. Proteome-pI 2.0: Proteome Isoelectric Point Database Update. Nucleic Acids Res. 2021, doi: 10.1093/nar/gkab944 | Contact: Lukasz P. Kozlowski |