Caldibacillus debilis
Taxonomy: cellular organisms; Bacteria; Terrabacteria group; Firmicutes; Bacilli; Bacillales; Bacillaceae; Caldibacillus
Average proteome isoelectric point is 7.47
Get precalculated fractions of proteins
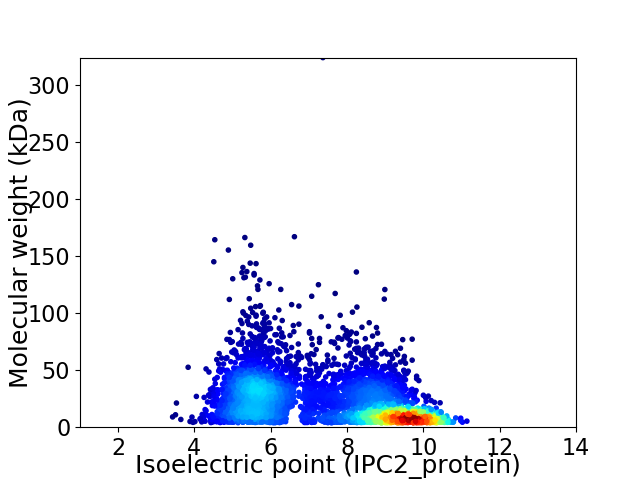
Virtual 2D-PAGE plot for 4240 proteins (isoelectric point calculated using IPC2_protein)
Get csv file with sequences according to given criteria:
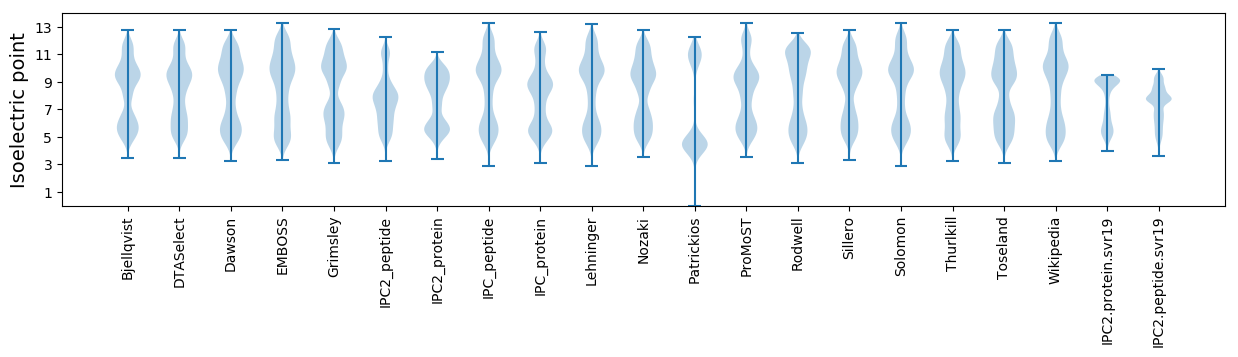
* You can choose from 21 different methods for calculating isoelectric point
Summary statistics related to proteome-wise predictions
Protein with the lowest isoelectric point:
>tr|A0A150M7X3|A0A150M7X3_9BACI 30S ribosomal protein S4 OS=Caldibacillus debilis OX=301148 GN=rpsD PE=3 SV=1
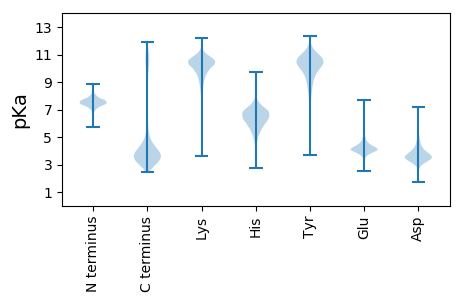
MM1 pKa = 7.14VCVDD5 pKa = 4.47KK6 pKa = 11.44NQEE9 pKa = 4.02EE10 pKa = 4.82YY11 pKa = 11.59GMEE14 pKa = 4.11SWNKK18 pKa = 8.98TIYY21 pKa = 10.5KK22 pKa = 9.78EE23 pKa = 3.96IIEE26 pKa = 4.33PEE28 pKa = 4.05KK29 pKa = 10.43IVYY32 pKa = 9.39IDD34 pKa = 3.8YY35 pKa = 10.94FSDD38 pKa = 3.81SEE40 pKa = 4.77GNMSS44 pKa = 3.79
MM1 pKa = 7.14VCVDD5 pKa = 4.47KK6 pKa = 11.44NQEE9 pKa = 4.02EE10 pKa = 4.82YY11 pKa = 11.59GMEE14 pKa = 4.11SWNKK18 pKa = 8.98TIYY21 pKa = 10.5KK22 pKa = 9.78EE23 pKa = 3.96IIEE26 pKa = 4.33PEE28 pKa = 4.05KK29 pKa = 10.43IVYY32 pKa = 9.39IDD34 pKa = 3.8YY35 pKa = 10.94FSDD38 pKa = 3.81SEE40 pKa = 4.77GNMSS44 pKa = 3.79
Molecular weight: 5.26 kDa
Isoelectric point according different methods:
Protein with the highest isoelectric point:
>tr|A0A150L9Q0|A0A150L9Q0_9BACI Transketolase N-terminal section OS=Caldibacillus debilis OX=301148 GN=B4135_4149 PE=4 SV=1
MM1 pKa = 7.34KK2 pKa = 10.42ASGGRR7 pKa = 11.84SRR9 pKa = 11.84VKK11 pKa = 10.05IRR13 pKa = 11.84PGNPAGATRR22 pKa = 11.84SARR25 pKa = 11.84RR26 pKa = 11.84APFSAFGGKK35 pKa = 9.54GRR37 pKa = 11.84ILLNLL42 pKa = 3.7
MM1 pKa = 7.34KK2 pKa = 10.42ASGGRR7 pKa = 11.84SRR9 pKa = 11.84VKK11 pKa = 10.05IRR13 pKa = 11.84PGNPAGATRR22 pKa = 11.84SARR25 pKa = 11.84RR26 pKa = 11.84APFSAFGGKK35 pKa = 9.54GRR37 pKa = 11.84ILLNLL42 pKa = 3.7
Molecular weight: 4.38 kDa
Isoelectric point according different methods:
Peptides (in silico digests for buttom-up proteomics)
Below you can find in silico digests of the whole proteome with Trypsin, Chymotrypsin, Trypsin+LysC, LysN, ArgC proteases suitable for different mass spec machines.| Try ESI |
 |
|---|
| ChTry ESI |
|
|---|
| ArgC ESI |
|
|---|
| LysN ESI |
|
|---|
| TryLysC ESI |
|
|---|
| Try MALDI |
|
|---|
| ChTry MALDI |
|
|---|
| ArgC MALDI |
|
|---|
| LysN MALDI |
|
|---|
| TryLysC MALDI |
|
|---|
| Try LTQ |
|
|---|
| ChTry LTQ |
|
|---|
| ArgC LTQ |
|
|---|
| LysN LTQ |
|
|---|
| TryLysC LTQ |
|
|---|
| Try MSlow |
|
|---|
| ChTry MSlow |
|
|---|
| ArgC MSlow |
|
|---|
| LysN MSlow |
|
|---|
| TryLysC MSlow |
|
|---|
| Try MShigh |
|
|---|
| ChTry MShigh |
|
|---|
| ArgC MShigh |
|
|---|
| LysN MShigh |
|
|---|
| TryLysC MShigh |
|
|---|
General Statistics
Number of major isoforms |
Number of additional isoforms |
Number of all proteins |
Number of amino acids |
Min. Seq. Length |
Max. Seq. Length |
Avg. Seq. Length |
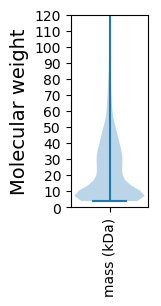
Avg. Mol. Weight |
|---|---|---|---|---|---|---|---|
0 |
910805 |
37 |
2865 |
214.8 |
24.2 |
Amino acid frequency
Ala |
Cys |
Asp |
Glu |
Phe |
Gly |
His |
Ile |
Lys |
Leu |
|---|---|---|---|---|---|---|---|---|---|
7.636 ± 0.046 | 0.849 ± 0.012 |
4.737 ± 0.032 | 7.63 ± 0.057 |
5.071 ± 0.048 | 7.627 ± 0.042 |
1.981 ± 0.017 | 7.019 ± 0.041 |
7.142 ± 0.037 | 9.675 ± 0.053 |
Met |
Asn |
Gln |
Pro |
Arg |
Ser |
Thr |
Val |
Trp |
Tyr |
|---|---|---|---|---|---|---|---|---|---|
2.645 ± 0.021 | 3.627 ± 0.03 |
4.53 ± 0.031 | 3.088 ± 0.025 |
6.046 ± 0.044 | 5.342 ± 0.035 |
4.562 ± 0.026 | 6.491 ± 0.033 |
1.059 ± 0.016 | 3.244 ± 0.026 |
Most of the basic statistics you can see at this page can be downloaded from this CSV file
See this proteome in:

Proteome-pI is available under Creative Commons Attribution-NoDerivs license, for more details see here
| Reference: Kozlowski LP. Proteome-pI 2.0: Proteome Isoelectric Point Database Update. Nucleic Acids Res. 2021, doi: 10.1093/nar/gkab944 | Contact: Lukasz P. Kozlowski |