Human immunodeficiency virus type 1 group M subtype B (strain 89.6) (HIV-1)
Taxonomy: Viruses; Riboviria; Pararnavirae; Artverviricota; Revtraviricetes; Ortervirales; Retroviridae; Orthoretrovirinae; Lentivirus; Human immunodeficiency virus 1; HIV-1 group M; HIV-1 M:B
Average proteome isoelectric point is 7.82
Get precalculated fractions of proteins
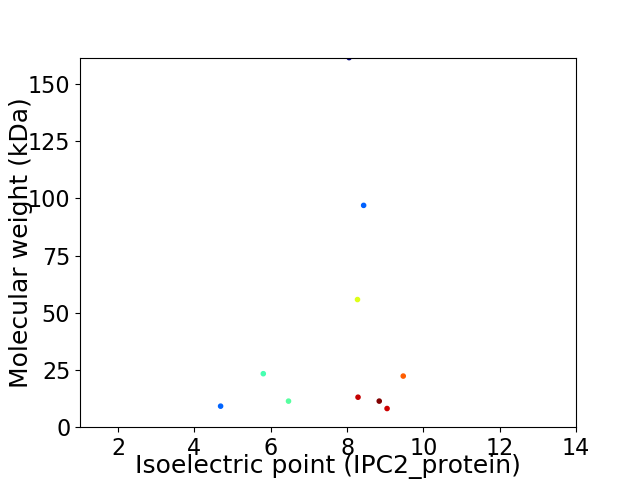
Virtual 2D-PAGE plot for 10 proteins (isoelectric point calculated using IPC2_protein)
Get csv file with sequences according to given criteria:
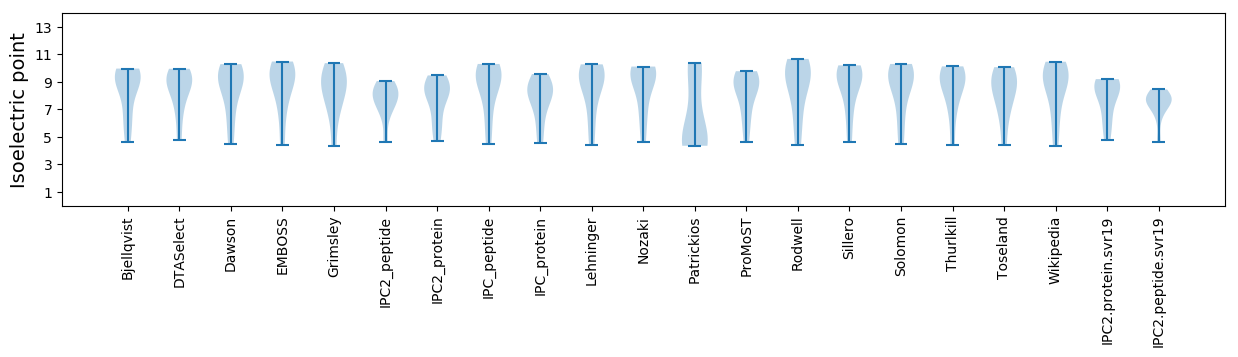
* You can choose from 21 different methods for calculating isoelectric point
Summary statistics related to proteome-wise predictions
Protein with the lowest isoelectric point:
>sp|Q73370-2|TAT-2_HV1B9 Isoform of Q73370 Isoform Short of Protein Tat OS=Human immunodeficiency virus type 1 group M subtype B (strain 89.6) OX=401671 GN=tat PE=4 SV=1
MM1 pKa = 7.74LSLQILAIVALVVAAIIAIVVWSIVFIEE29 pKa = 3.94YY30 pKa = 10.41RR31 pKa = 11.84KK32 pKa = 9.66ILRR35 pKa = 11.84QRR37 pKa = 11.84KK38 pKa = 8.02IDD40 pKa = 3.69RR41 pKa = 11.84LIDD44 pKa = 4.31RR45 pKa = 11.84IRR47 pKa = 11.84EE48 pKa = 3.99RR49 pKa = 11.84EE50 pKa = 3.78EE51 pKa = 4.6DD52 pKa = 3.51SGNEE56 pKa = 3.94SEE58 pKa = 5.46GDD60 pKa = 3.79QEE62 pKa = 4.05EE63 pKa = 4.39LAALEE68 pKa = 4.57RR69 pKa = 11.84GHH71 pKa = 7.06LAPWDD76 pKa = 3.77VDD78 pKa = 3.88DD79 pKa = 5.48LL80 pKa = 4.6
MM1 pKa = 7.74LSLQILAIVALVVAAIIAIVVWSIVFIEE29 pKa = 3.94YY30 pKa = 10.41RR31 pKa = 11.84KK32 pKa = 9.66ILRR35 pKa = 11.84QRR37 pKa = 11.84KK38 pKa = 8.02IDD40 pKa = 3.69RR41 pKa = 11.84LIDD44 pKa = 4.31RR45 pKa = 11.84IRR47 pKa = 11.84EE48 pKa = 3.99RR49 pKa = 11.84EE50 pKa = 3.78EE51 pKa = 4.6DD52 pKa = 3.51SGNEE56 pKa = 3.94SEE58 pKa = 5.46GDD60 pKa = 3.79QEE62 pKa = 4.05EE63 pKa = 4.39LAALEE68 pKa = 4.57RR69 pKa = 11.84GHH71 pKa = 7.06LAPWDD76 pKa = 3.77VDD78 pKa = 3.88DD79 pKa = 5.48LL80 pKa = 4.6
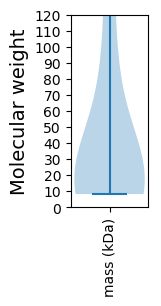
Molecular weight: 9.2 kDa
Isoelectric point according different methods:
Protein with the highest isoelectric point:
>sp|Q89842|NEF_HV1B9 Protein Nef OS=Human immunodeficiency virus type 1 group M subtype B (strain 89.6) OX=401671 GN=nef PE=3 SV=3
MM1 pKa = 7.3EE2 pKa = 5.21NRR4 pKa = 11.84WQVMIVWQVDD14 pKa = 3.04RR15 pKa = 11.84MRR17 pKa = 11.84IRR19 pKa = 11.84TWKK22 pKa = 10.59SLVKK26 pKa = 9.59HH27 pKa = 6.07HH28 pKa = 6.5MYY30 pKa = 10.55ISGKK34 pKa = 9.99AKK36 pKa = 8.19GWSYY40 pKa = 9.29RR41 pKa = 11.84HH42 pKa = 6.44HH43 pKa = 6.86YY44 pKa = 10.29EE45 pKa = 3.75STNPRR50 pKa = 11.84ISSEE54 pKa = 3.9VHH56 pKa = 5.92IPLGDD61 pKa = 3.56AKK63 pKa = 10.91LVVTTYY69 pKa = 9.85WGLHH73 pKa = 4.29TGEE76 pKa = 4.83RR77 pKa = 11.84DD78 pKa = 2.76WHH80 pKa = 6.32LGQGVSIEE88 pKa = 4.03WRR90 pKa = 11.84KK91 pKa = 10.19KK92 pKa = 9.67RR93 pKa = 11.84YY94 pKa = 7.56STQVDD99 pKa = 3.34PGLADD104 pKa = 3.92RR105 pKa = 11.84LIHH108 pKa = 7.11LYY110 pKa = 10.95YY111 pKa = 10.3FDD113 pKa = 5.21CFSDD117 pKa = 3.48SAIRR121 pKa = 11.84KK122 pKa = 9.29SILGHH127 pKa = 5.81IVSPSCEE134 pKa = 3.9YY135 pKa = 10.44QAGHH139 pKa = 6.2NKK141 pKa = 9.66VGSLQYY147 pKa = 10.68LALAALTTPRR157 pKa = 11.84RR158 pKa = 11.84IKK160 pKa = 10.62PPFPSVTKK168 pKa = 9.6LTEE171 pKa = 4.23DD172 pKa = 3.49RR173 pKa = 11.84WNKK176 pKa = 7.33PQKK179 pKa = 9.13TKK181 pKa = 8.84GHH183 pKa = 6.54RR184 pKa = 11.84GSHH187 pKa = 4.99TMTGHH192 pKa = 6.71
MM1 pKa = 7.3EE2 pKa = 5.21NRR4 pKa = 11.84WQVMIVWQVDD14 pKa = 3.04RR15 pKa = 11.84MRR17 pKa = 11.84IRR19 pKa = 11.84TWKK22 pKa = 10.59SLVKK26 pKa = 9.59HH27 pKa = 6.07HH28 pKa = 6.5MYY30 pKa = 10.55ISGKK34 pKa = 9.99AKK36 pKa = 8.19GWSYY40 pKa = 9.29RR41 pKa = 11.84HH42 pKa = 6.44HH43 pKa = 6.86YY44 pKa = 10.29EE45 pKa = 3.75STNPRR50 pKa = 11.84ISSEE54 pKa = 3.9VHH56 pKa = 5.92IPLGDD61 pKa = 3.56AKK63 pKa = 10.91LVVTTYY69 pKa = 9.85WGLHH73 pKa = 4.29TGEE76 pKa = 4.83RR77 pKa = 11.84DD78 pKa = 2.76WHH80 pKa = 6.32LGQGVSIEE88 pKa = 4.03WRR90 pKa = 11.84KK91 pKa = 10.19KK92 pKa = 9.67RR93 pKa = 11.84YY94 pKa = 7.56STQVDD99 pKa = 3.34PGLADD104 pKa = 3.92RR105 pKa = 11.84LIHH108 pKa = 7.11LYY110 pKa = 10.95YY111 pKa = 10.3FDD113 pKa = 5.21CFSDD117 pKa = 3.48SAIRR121 pKa = 11.84KK122 pKa = 9.29SILGHH127 pKa = 5.81IVSPSCEE134 pKa = 3.9YY135 pKa = 10.44QAGHH139 pKa = 6.2NKK141 pKa = 9.66VGSLQYY147 pKa = 10.68LALAALTTPRR157 pKa = 11.84RR158 pKa = 11.84IKK160 pKa = 10.62PPFPSVTKK168 pKa = 9.6LTEE171 pKa = 4.23DD172 pKa = 3.49RR173 pKa = 11.84WNKK176 pKa = 7.33PQKK179 pKa = 9.13TKK181 pKa = 8.84GHH183 pKa = 6.54RR184 pKa = 11.84GSHH187 pKa = 4.99TMTGHH192 pKa = 6.71
Molecular weight: 22.35 kDa
Isoelectric point according different methods:
Peptides (in silico digests for buttom-up proteomics)
Below you can find in silico digests of the whole proteome with Trypsin, Chymotrypsin, Trypsin+LysC, LysN, ArgC proteases suitable for different mass spec machines.| Try ESI |
 |
|---|
| ChTry ESI |
|
|---|
| ArgC ESI |
|
|---|
| LysN ESI |
|
|---|
| TryLysC ESI |
|
|---|
| Try MALDI |
|
|---|
| ChTry MALDI |
|
|---|
| ArgC MALDI |
|
|---|
| LysN MALDI |
|
|---|
| TryLysC MALDI |
|
|---|
| Try LTQ |
|
|---|
| ChTry LTQ |
|
|---|
| ArgC LTQ |
|
|---|
| LysN LTQ |
|
|---|
| TryLysC LTQ |
|
|---|
| Try MSlow |
|
|---|
| ChTry MSlow |
|
|---|
| ArgC MSlow |
|
|---|
| LysN MSlow |
|
|---|
| TryLysC MSlow |
|
|---|
| Try MShigh |
|
|---|
| ChTry MShigh |
|
|---|
| ArgC MShigh |
|
|---|
| LysN MShigh |
|
|---|
| TryLysC MShigh |
|
|---|
General Statistics
Number of major isoforms |
Number of additional isoforms |
Number of all proteins |
Number of amino acids |
Min. Seq. Length |
Max. Seq. Length |
Avg. Seq. Length |
Avg. Mol. Weight |
|---|---|---|---|---|---|---|---|
3647 |
71 |
1435 |
364.7 |
41.33 |
Amino acid frequency
Ala |
Cys |
Asp |
Glu |
Phe |
Gly |
His |
Ile |
Lys |
Leu |
|---|---|---|---|---|---|---|---|---|---|
6.224 ± 0.473 | 2.002 ± 0.437 |
4.003 ± 0.407 | 6.965 ± 0.515 |
2.577 ± 0.153 | 7.239 ± 0.228 |
2.194 ± 0.481 | 6.307 ± 0.507 |
7.102 ± 1.05 | 8.226 ± 0.58 |
Met |
Asn |
Gln |
Pro |
Arg |
Ser |
Thr |
Val |
Trp |
Tyr |
|---|---|---|---|---|---|---|---|---|---|
2.111 ± 0.203 | 4.661 ± 0.859 |
5.292 ± 0.567 | 5.895 ± 0.499 |
6.252 ± 1.02 | 5.539 ± 0.454 |
6.005 ± 0.466 | 6.197 ± 0.425 |
2.66 ± 0.222 | 2.55 ± 0.191 |
Most of the basic statistics you can see at this page can be downloaded from this CSV file
See this proteome in:

Proteome-pI is available under Creative Commons Attribution-NoDerivs license, for more details see here
| Reference: Kozlowski LP. Proteome-pI 2.0: Proteome Isoelectric Point Database Update. Nucleic Acids Res. 2021, doi: 10.1093/nar/gkab944 | Contact: Lukasz P. Kozlowski |