Streptococcus satellite phage Javan747
Taxonomy: Viruses; unclassified bacterial viruses
Average proteome isoelectric point is 6.62
Get precalculated fractions of proteins
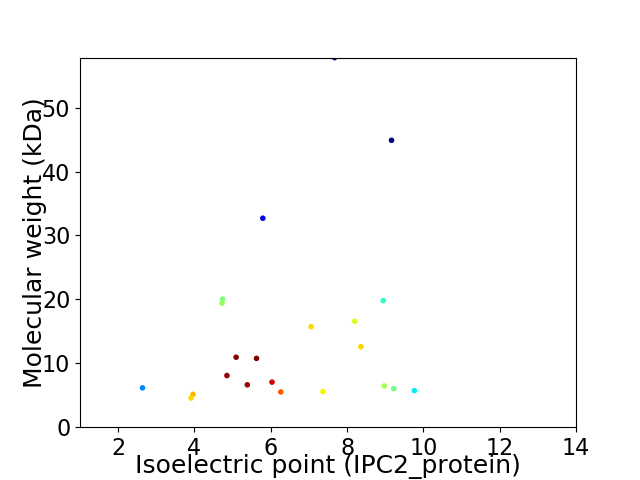
Virtual 2D-PAGE plot for 22 proteins (isoelectric point calculated using IPC2_protein)
Get csv file with sequences according to given criteria:
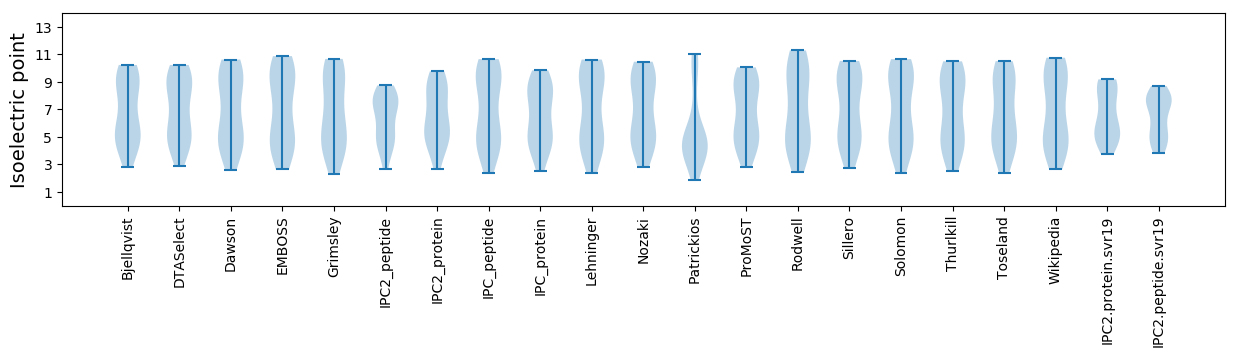
* You can choose from 21 different methods for calculating isoelectric point
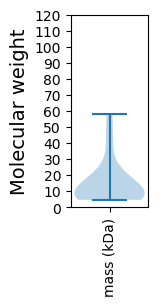
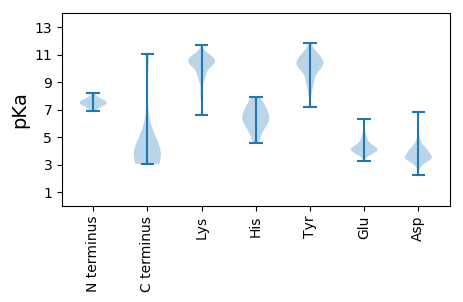
Summary statistics related to proteome-wise predictions
Protein with the lowest isoelectric point:
>tr|A0A4D6A0L6|A0A4D6A0L6_9VIRU Uncharacterized protein OS=Streptococcus satellite phage Javan747 OX=2558841 GN=JavanS747_0016 PE=4 SV=1
MM1 pKa = 7.87EE2 pKa = 4.51EE3 pKa = 3.56TTYY6 pKa = 11.03DD7 pKa = 3.82IIAKK11 pKa = 9.74SLDD14 pKa = 4.0RR15 pKa = 11.84ISMEE19 pKa = 3.74LHH21 pKa = 5.91QADD24 pKa = 4.33EE25 pKa = 4.59NNDD28 pKa = 3.14FLEE31 pKa = 4.3YY32 pKa = 10.95GFYY35 pKa = 10.31QDD37 pKa = 3.87NN38 pKa = 3.58
MM1 pKa = 7.87EE2 pKa = 4.51EE3 pKa = 3.56TTYY6 pKa = 11.03DD7 pKa = 3.82IIAKK11 pKa = 9.74SLDD14 pKa = 4.0RR15 pKa = 11.84ISMEE19 pKa = 3.74LHH21 pKa = 5.91QADD24 pKa = 4.33EE25 pKa = 4.59NNDD28 pKa = 3.14FLEE31 pKa = 4.3YY32 pKa = 10.95GFYY35 pKa = 10.31QDD37 pKa = 3.87NN38 pKa = 3.58
Molecular weight: 4.56 kDa
Isoelectric point according different methods:
Protein with the highest isoelectric point:
>tr|A0A4D5ZVC8|A0A4D5ZVC8_9VIRU Uncharacterized protein OS=Streptococcus satellite phage Javan747 OX=2558841 GN=JavanS747_0019 PE=4 SV=1
MM1 pKa = 7.27GRR3 pKa = 11.84YY4 pKa = 7.19NTHH7 pKa = 6.77PAQGGGHH14 pKa = 4.78YY15 pKa = 10.27HH16 pKa = 7.73DD17 pKa = 4.02IKK19 pKa = 10.7LYY21 pKa = 8.35KK22 pKa = 9.91HH23 pKa = 6.74RR24 pKa = 11.84GRR26 pKa = 11.84SLEE29 pKa = 3.76QFQEE33 pKa = 3.93QKK35 pKa = 10.94LLKK38 pKa = 10.02KK39 pKa = 10.45LKK41 pKa = 8.73KK42 pKa = 6.6TQKK45 pKa = 10.32GAIVV49 pKa = 3.22
MM1 pKa = 7.27GRR3 pKa = 11.84YY4 pKa = 7.19NTHH7 pKa = 6.77PAQGGGHH14 pKa = 4.78YY15 pKa = 10.27HH16 pKa = 7.73DD17 pKa = 4.02IKK19 pKa = 10.7LYY21 pKa = 8.35KK22 pKa = 9.91HH23 pKa = 6.74RR24 pKa = 11.84GRR26 pKa = 11.84SLEE29 pKa = 3.76QFQEE33 pKa = 3.93QKK35 pKa = 10.94LLKK38 pKa = 10.02KK39 pKa = 10.45LKK41 pKa = 8.73KK42 pKa = 6.6TQKK45 pKa = 10.32GAIVV49 pKa = 3.22
Molecular weight: 5.72 kDa
Isoelectric point according different methods:
Peptides (in silico digests for buttom-up proteomics)
Below you can find in silico digests of the whole proteome with Trypsin, Chymotrypsin, Trypsin+LysC, LysN, ArgC proteases suitable for different mass spec machines.| Try ESI |
 |
|---|
| ChTry ESI |
|
|---|
| ArgC ESI |
|
|---|
| LysN ESI |
|
|---|
| TryLysC ESI |
|
|---|
| Try MALDI |
|
|---|
| ChTry MALDI |
|
|---|
| ArgC MALDI |
|
|---|
| LysN MALDI |
|
|---|
| TryLysC MALDI |
|
|---|
| Try LTQ |
|
|---|
| ChTry LTQ |
|
|---|
| ArgC LTQ |
|
|---|
| LysN LTQ |
|
|---|
| TryLysC LTQ |
|
|---|
| Try MSlow |
|
|---|
| ChTry MSlow |
|
|---|
| ArgC MSlow |
|
|---|
| LysN MSlow |
|
|---|
| TryLysC MSlow |
|
|---|
| Try MShigh |
|
|---|
| ChTry MShigh |
|
|---|
| ArgC MShigh |
|
|---|
| LysN MShigh |
|
|---|
| TryLysC MShigh |
|
|---|
General Statistics
Number of major isoforms |
Number of additional isoforms |
Number of all proteins |
Number of amino acids |
Min. Seq. Length |
Max. Seq. Length |
Avg. Seq. Length |
Avg. Mol. Weight |
|---|---|---|---|---|---|---|---|
0 |
2824 |
38 |
496 |
128.4 |
14.92 |
Amino acid frequency
Ala |
Cys |
Asp |
Glu |
Phe |
Gly |
His |
Ile |
Lys |
Leu |
|---|---|---|---|---|---|---|---|---|---|
4.922 ± 0.302 | 0.921 ± 0.206 |
6.374 ± 0.487 | 8.428 ± 0.654 |
4.32 ± 0.308 | 5.489 ± 0.4 |
1.523 ± 0.247 | 6.657 ± 0.484 |
9.101 ± 0.778 | 10.269 ± 0.527 |
Met |
Asn |
Gln |
Pro |
Arg |
Ser |
Thr |
Val |
Trp |
Tyr |
|---|---|---|---|---|---|---|---|---|---|
2.904 ± 0.287 | 4.993 ± 0.466 |
3.01 ± 0.579 | 3.47 ± 0.254 |
5.914 ± 0.458 | 5.241 ± 0.262 |
5.453 ± 0.559 | 5.276 ± 0.505 |
1.027 ± 0.227 | 4.71 ± 0.36 |
Most of the basic statistics you can see at this page can be downloaded from this CSV file
See this proteome in:

Proteome-pI is available under Creative Commons Attribution-NoDerivs license, for more details see here
| Reference: Kozlowski LP. Proteome-pI 2.0: Proteome Isoelectric Point Database Update. Nucleic Acids Res. 2021, doi: 10.1093/nar/gkab944 | Contact: Lukasz P. Kozlowski |