Tortoise microvirus 78
Taxonomy: Viruses; Monodnaviria; Sangervirae; Phixviricota; Malgrandaviricetes; Petitvirales; Microviridae; unclassified Microviridae
Average proteome isoelectric point is 7.04
Get precalculated fractions of proteins
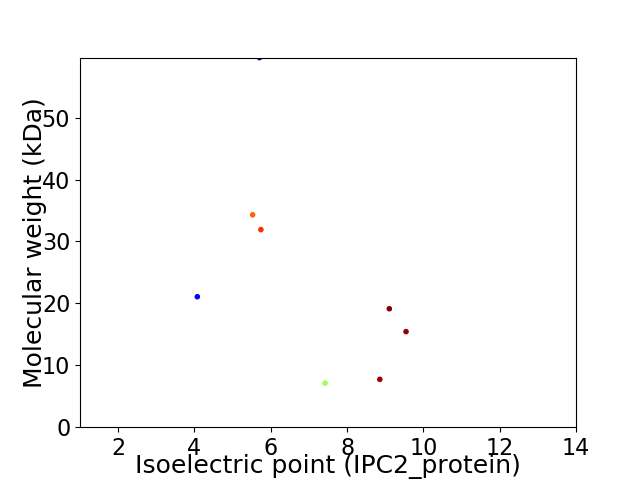
Virtual 2D-PAGE plot for 8 proteins (isoelectric point calculated using IPC2_protein)
Get csv file with sequences according to given criteria:
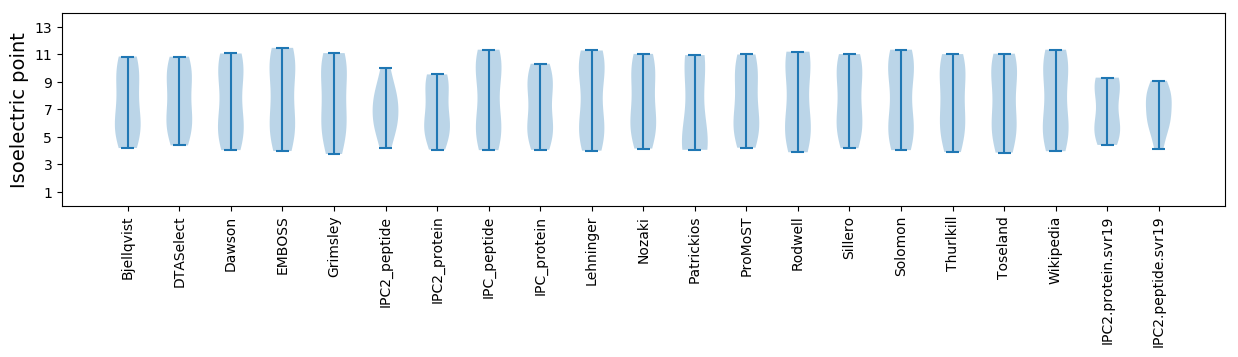
* You can choose from 21 different methods for calculating isoelectric point
Summary statistics related to proteome-wise predictions
Protein with the lowest isoelectric point:
>tr|A0A4P8W7R4|A0A4P8W7R4_9VIRU Uncharacterized protein OS=Tortoise microvirus 78 OX=2583185 PE=4 SV=1
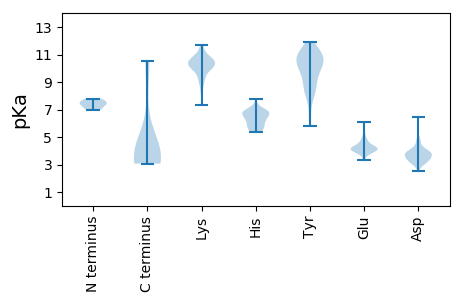
MM1 pKa = 7.64AIKK4 pKa = 10.69VGDD7 pKa = 3.83LNRR10 pKa = 11.84WKK12 pKa = 10.23QLKK15 pKa = 10.61LGDD18 pKa = 4.06ALALNSDD25 pKa = 3.65RR26 pKa = 11.84QRR28 pKa = 11.84QVRR31 pKa = 11.84LEE33 pKa = 4.26VNVDD37 pKa = 3.14QPTQVMAVRR46 pKa = 11.84GTDD49 pKa = 3.39VVLLGVVMGMDD60 pKa = 3.85VIEE63 pKa = 4.67FVTDD67 pKa = 4.01GPTEE71 pKa = 3.98VAFTTEE77 pKa = 3.84GQVFYY82 pKa = 8.05FTRR85 pKa = 11.84DD86 pKa = 3.17GDD88 pKa = 4.31SEE90 pKa = 4.75ALDD93 pKa = 3.61LVEE96 pKa = 4.48EE97 pKa = 4.49VSFATLANRR106 pKa = 11.84RR107 pKa = 11.84ARR109 pKa = 11.84NPQVEE114 pKa = 4.32LMFYY118 pKa = 11.13KK119 pKa = 10.24MNQNMEE125 pKa = 4.02RR126 pKa = 11.84RR127 pKa = 11.84LAQQADD133 pKa = 3.61DD134 pKa = 3.88FEE136 pKa = 6.1RR137 pKa = 11.84RR138 pKa = 11.84MAEE141 pKa = 3.67MGYY144 pKa = 10.61DD145 pKa = 3.72PDD147 pKa = 4.0TGEE150 pKa = 4.99VADD153 pKa = 5.5DD154 pKa = 4.79DD155 pKa = 5.74DD156 pKa = 6.45DD157 pKa = 4.26GTVEE161 pKa = 4.42GDD163 pKa = 3.23TAAAEE168 pKa = 4.04AAAGGISGTDD178 pKa = 3.24AEE180 pKa = 4.76ASGDD184 pKa = 3.58AARR187 pKa = 11.84APGGGAGTAA196 pKa = 3.64
MM1 pKa = 7.64AIKK4 pKa = 10.69VGDD7 pKa = 3.83LNRR10 pKa = 11.84WKK12 pKa = 10.23QLKK15 pKa = 10.61LGDD18 pKa = 4.06ALALNSDD25 pKa = 3.65RR26 pKa = 11.84QRR28 pKa = 11.84QVRR31 pKa = 11.84LEE33 pKa = 4.26VNVDD37 pKa = 3.14QPTQVMAVRR46 pKa = 11.84GTDD49 pKa = 3.39VVLLGVVMGMDD60 pKa = 3.85VIEE63 pKa = 4.67FVTDD67 pKa = 4.01GPTEE71 pKa = 3.98VAFTTEE77 pKa = 3.84GQVFYY82 pKa = 8.05FTRR85 pKa = 11.84DD86 pKa = 3.17GDD88 pKa = 4.31SEE90 pKa = 4.75ALDD93 pKa = 3.61LVEE96 pKa = 4.48EE97 pKa = 4.49VSFATLANRR106 pKa = 11.84RR107 pKa = 11.84ARR109 pKa = 11.84NPQVEE114 pKa = 4.32LMFYY118 pKa = 11.13KK119 pKa = 10.24MNQNMEE125 pKa = 4.02RR126 pKa = 11.84RR127 pKa = 11.84LAQQADD133 pKa = 3.61DD134 pKa = 3.88FEE136 pKa = 6.1RR137 pKa = 11.84RR138 pKa = 11.84MAEE141 pKa = 3.67MGYY144 pKa = 10.61DD145 pKa = 3.72PDD147 pKa = 4.0TGEE150 pKa = 4.99VADD153 pKa = 5.5DD154 pKa = 4.79DD155 pKa = 5.74DD156 pKa = 6.45DD157 pKa = 4.26GTVEE161 pKa = 4.42GDD163 pKa = 3.23TAAAEE168 pKa = 4.04AAAGGISGTDD178 pKa = 3.24AEE180 pKa = 4.76ASGDD184 pKa = 3.58AARR187 pKa = 11.84APGGGAGTAA196 pKa = 3.64
Molecular weight: 21.07 kDa
Isoelectric point according different methods:
Protein with the highest isoelectric point:
>tr|A0A4V1FW10|A0A4V1FW10_9VIRU Uncharacterized protein OS=Tortoise microvirus 78 OX=2583185 PE=4 SV=1
MM1 pKa = 7.8PSHH4 pKa = 6.94SSSEE8 pKa = 4.21SLSGSEE14 pKa = 4.74GGEE17 pKa = 4.01TTLGRR22 pKa = 11.84TARR25 pKa = 11.84EE26 pKa = 3.43RR27 pKa = 11.84GARR30 pKa = 11.84LASQAPVQPPRR41 pKa = 11.84APDD44 pKa = 3.71PVILAPTNPITPVNPAQEE62 pKa = 3.69AAARR66 pKa = 11.84RR67 pKa = 11.84VHH69 pKa = 6.16SLPGGTLRR77 pKa = 11.84GTQNNTTRR85 pKa = 11.84TVSTAKK91 pKa = 9.93VRR93 pKa = 11.84PDD95 pKa = 3.22DD96 pKa = 3.98AKK98 pKa = 11.3ARR100 pKa = 11.84TQVQPSKK107 pKa = 10.76AARR110 pKa = 11.84DD111 pKa = 3.48DD112 pKa = 3.88RR113 pKa = 11.84EE114 pKa = 3.69PDD116 pKa = 3.4KK117 pKa = 11.26RR118 pKa = 11.84WVCKK122 pKa = 10.29ARR124 pKa = 11.84PEE126 pKa = 4.32SNKK129 pKa = 10.04PKK131 pKa = 10.61GGGGGAKK138 pKa = 9.72RR139 pKa = 11.84AFIPWCSS146 pKa = 3.07
MM1 pKa = 7.8PSHH4 pKa = 6.94SSSEE8 pKa = 4.21SLSGSEE14 pKa = 4.74GGEE17 pKa = 4.01TTLGRR22 pKa = 11.84TARR25 pKa = 11.84EE26 pKa = 3.43RR27 pKa = 11.84GARR30 pKa = 11.84LASQAPVQPPRR41 pKa = 11.84APDD44 pKa = 3.71PVILAPTNPITPVNPAQEE62 pKa = 3.69AAARR66 pKa = 11.84RR67 pKa = 11.84VHH69 pKa = 6.16SLPGGTLRR77 pKa = 11.84GTQNNTTRR85 pKa = 11.84TVSTAKK91 pKa = 9.93VRR93 pKa = 11.84PDD95 pKa = 3.22DD96 pKa = 3.98AKK98 pKa = 11.3ARR100 pKa = 11.84TQVQPSKK107 pKa = 10.76AARR110 pKa = 11.84DD111 pKa = 3.48DD112 pKa = 3.88RR113 pKa = 11.84EE114 pKa = 3.69PDD116 pKa = 3.4KK117 pKa = 11.26RR118 pKa = 11.84WVCKK122 pKa = 10.29ARR124 pKa = 11.84PEE126 pKa = 4.32SNKK129 pKa = 10.04PKK131 pKa = 10.61GGGGGAKK138 pKa = 9.72RR139 pKa = 11.84AFIPWCSS146 pKa = 3.07
Molecular weight: 15.44 kDa
Isoelectric point according different methods:
Peptides (in silico digests for buttom-up proteomics)
Below you can find in silico digests of the whole proteome with Trypsin, Chymotrypsin, Trypsin+LysC, LysN, ArgC proteases suitable for different mass spec machines.| Try ESI |
 |
|---|
| ChTry ESI |
|
|---|
| ArgC ESI |
|
|---|
| LysN ESI |
|
|---|
| TryLysC ESI |
|
|---|
| Try MALDI |
|
|---|
| ChTry MALDI |
|
|---|
| ArgC MALDI |
|
|---|
| LysN MALDI |
|
|---|
| TryLysC MALDI |
|
|---|
| Try LTQ |
|
|---|
| ChTry LTQ |
|
|---|
| ArgC LTQ |
|
|---|
| LysN LTQ |
|
|---|
| TryLysC LTQ |
|
|---|
| Try MSlow |
|
|---|
| ChTry MSlow |
|
|---|
| ArgC MSlow |
|
|---|
| LysN MSlow |
|
|---|
| TryLysC MSlow |
|
|---|
| Try MShigh |
|
|---|
| ChTry MShigh |
|
|---|
| ArgC MShigh |
|
|---|
| LysN MShigh |
|
|---|
| TryLysC MShigh |
|
|---|
General Statistics
Number of major isoforms |
Number of additional isoforms |
Number of all proteins |
Number of amino acids |
Min. Seq. Length |
Max. Seq. Length |
Avg. Seq. Length |
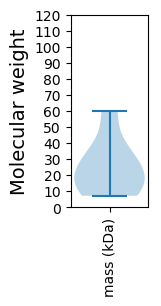
Avg. Mol. Weight |
|---|---|---|---|---|---|---|---|
0 |
1800 |
69 |
541 |
225.0 |
24.55 |
Amino acid frequency
Ala |
Cys |
Asp |
Glu |
Phe |
Gly |
His |
Ile |
Lys |
Leu |
|---|---|---|---|---|---|---|---|---|---|
10.778 ± 0.846 | 0.111 ± 0.114 |
5.722 ± 0.642 | 6.056 ± 0.858 |
3.111 ± 0.459 | 10.389 ± 0.913 |
1.833 ± 0.51 | 3.167 ± 0.49 |
4.5 ± 0.408 | 7.556 ± 0.92 |
Met |
Asn |
Gln |
Pro |
Arg |
Ser |
Thr |
Val |
Trp |
Tyr |
|---|---|---|---|---|---|---|---|---|---|
2.333 ± 0.436 | 4.056 ± 0.828 |
6.944 ± 0.971 | 4.778 ± 0.245 |
6.5 ± 0.717 | 4.944 ± 0.718 |
4.944 ± 0.682 | 7.333 ± 1.265 |
2.5 ± 0.593 | 2.444 ± 0.723 |
Most of the basic statistics you can see at this page can be downloaded from this CSV file
See this proteome in:

Proteome-pI is available under Creative Commons Attribution-NoDerivs license, for more details see here
| Reference: Kozlowski LP. Proteome-pI 2.0: Proteome Isoelectric Point Database Update. Nucleic Acids Res. 2021, doi: 10.1093/nar/gkab944 | Contact: Lukasz P. Kozlowski |