Wheat stripe mosaic virus
Taxonomy: Viruses; Riboviria; Orthornavirae; Kitrinoviricota; Alsuviricetes; Hepelivirales; Benyviridae; unclassified Benyviridae
Average proteome isoelectric point is 6.32
Get precalculated fractions of proteins
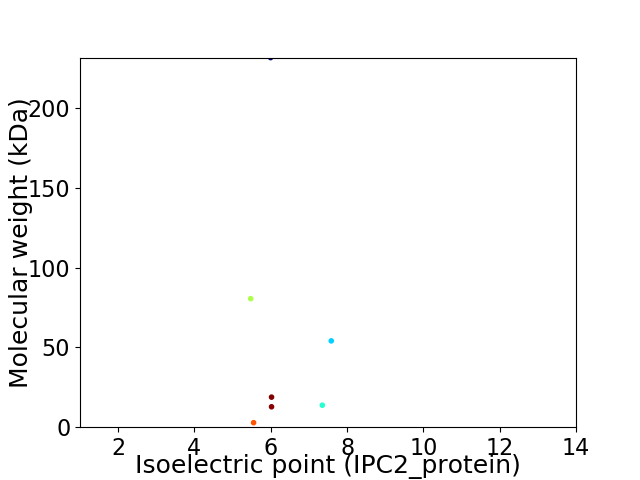
Virtual 2D-PAGE plot for 7 proteins (isoelectric point calculated using IPC2_protein)
Get csv file with sequences according to given criteria:
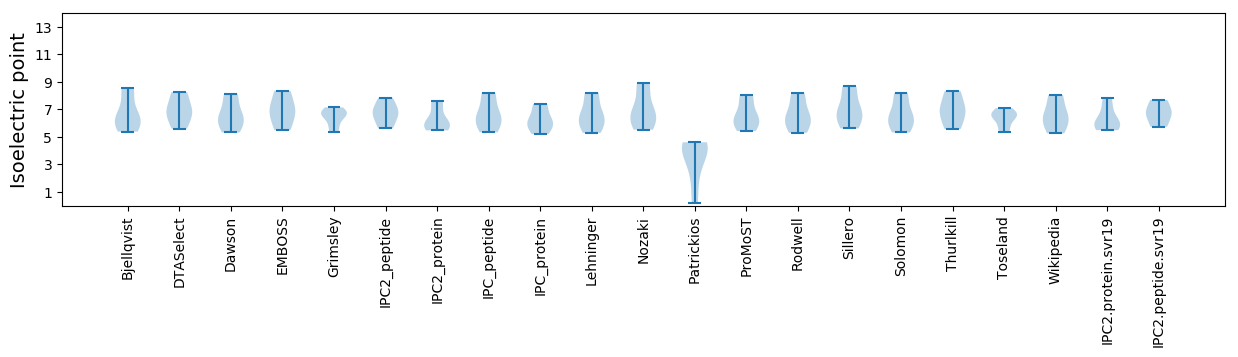
* You can choose from 21 different methods for calculating isoelectric point
Summary statistics related to proteome-wise predictions
Protein with the lowest isoelectric point:
>tr|A0A386GYE2|A0A386GYE2_9VIRU TGB2 OS=Wheat stripe mosaic virus OX=2364281 PE=4 SV=1
MM1 pKa = 7.66CGFGGIIEE9 pKa = 4.38VCGYY13 pKa = 7.29LHH15 pKa = 7.66CEE17 pKa = 4.14TLWLSVKK24 pKa = 9.5ATT26 pKa = 3.52
MM1 pKa = 7.66CGFGGIIEE9 pKa = 4.38VCGYY13 pKa = 7.29LHH15 pKa = 7.66CEE17 pKa = 4.14TLWLSVKK24 pKa = 9.5ATT26 pKa = 3.52
Molecular weight: 2.83 kDa
Isoelectric point according different methods:
Protein with the highest isoelectric point:
>tr|A0A386GYE2|A0A386GYE2_9VIRU TGB2 OS=Wheat stripe mosaic virus OX=2364281 PE=4 SV=1
MM1 pKa = 7.67SDD3 pKa = 2.79KK4 pKa = 10.77DD5 pKa = 3.52YY6 pKa = 11.2RR7 pKa = 11.84FNGGGGGRR15 pKa = 11.84GLAQKK20 pKa = 10.71GDD22 pKa = 3.52QTLWICVVAAVVIMCGMFVLGPNKK46 pKa = 9.94HH47 pKa = 5.47RR48 pKa = 11.84THH50 pKa = 6.41SAGDD54 pKa = 3.47YY55 pKa = 9.82GVPTFANGGSYY66 pKa = 10.8KK67 pKa = 10.75DD68 pKa = 3.66GTRR71 pKa = 11.84QATFNKK77 pKa = 8.82ASNMAYY83 pKa = 9.95GGHH86 pKa = 6.18GSKK89 pKa = 10.97GLTNGFILAIVVCICWLAACWFLPKK114 pKa = 10.37PEE116 pKa = 4.91DD117 pKa = 3.67EE118 pKa = 5.59CDD120 pKa = 3.67GACCPVRR127 pKa = 11.84GGGGCC132 pKa = 3.55
MM1 pKa = 7.67SDD3 pKa = 2.79KK4 pKa = 10.77DD5 pKa = 3.52YY6 pKa = 11.2RR7 pKa = 11.84FNGGGGGRR15 pKa = 11.84GLAQKK20 pKa = 10.71GDD22 pKa = 3.52QTLWICVVAAVVIMCGMFVLGPNKK46 pKa = 9.94HH47 pKa = 5.47RR48 pKa = 11.84THH50 pKa = 6.41SAGDD54 pKa = 3.47YY55 pKa = 9.82GVPTFANGGSYY66 pKa = 10.8KK67 pKa = 10.75DD68 pKa = 3.66GTRR71 pKa = 11.84QATFNKK77 pKa = 8.82ASNMAYY83 pKa = 9.95GGHH86 pKa = 6.18GSKK89 pKa = 10.97GLTNGFILAIVVCICWLAACWFLPKK114 pKa = 10.37PEE116 pKa = 4.91DD117 pKa = 3.67EE118 pKa = 5.59CDD120 pKa = 3.67GACCPVRR127 pKa = 11.84GGGGCC132 pKa = 3.55
Molecular weight: 13.79 kDa
Isoelectric point according different methods:
Peptides (in silico digests for buttom-up proteomics)
Below you can find in silico digests of the whole proteome with Trypsin, Chymotrypsin, Trypsin+LysC, LysN, ArgC proteases suitable for different mass spec machines.| Try ESI |
 |
|---|
| ChTry ESI |
|
|---|
| ArgC ESI |
|
|---|
| LysN ESI |
|
|---|
| TryLysC ESI |
|
|---|
| Try MALDI |
|
|---|
| ChTry MALDI |
|
|---|
| ArgC MALDI |
|
|---|
| LysN MALDI |
|
|---|
| TryLysC MALDI |
|
|---|
| Try LTQ |
|
|---|
| ChTry LTQ |
|
|---|
| ArgC LTQ |
|
|---|
| LysN LTQ |
|
|---|
| TryLysC LTQ |
|
|---|
| Try MSlow |
|
|---|
| ChTry MSlow |
|
|---|
| ArgC MSlow |
|
|---|
| LysN MSlow |
|
|---|
| TryLysC MSlow |
|
|---|
| Try MShigh |
|
|---|
| ChTry MShigh |
|
|---|
| ArgC MShigh |
|
|---|
| LysN MShigh |
|
|---|
| TryLysC MShigh |
|
|---|
General Statistics
Number of major isoforms |
Number of additional isoforms |
Number of all proteins |
Number of amino acids |
Min. Seq. Length |
Max. Seq. Length |
Avg. Seq. Length |
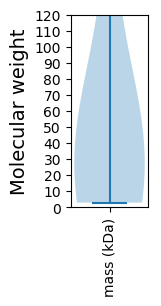
Avg. Mol. Weight |
|---|---|---|---|---|---|---|---|
0 |
3742 |
26 |
2043 |
534.6 |
59.22 |
Amino acid frequency
Ala |
Cys |
Asp |
Glu |
Phe |
Gly |
His |
Ile |
Lys |
Leu |
|---|---|---|---|---|---|---|---|---|---|
8.952 ± 0.294 | 1.657 ± 0.675 |
5.772 ± 0.42 | 5.933 ± 0.665 |
4.303 ± 0.609 | 7.563 ± 2.225 |
2.565 ± 0.136 | 3.688 ± 0.48 |
4.837 ± 0.886 | 9.327 ± 0.845 |
Met |
Asn |
Gln |
Pro |
Arg |
Ser |
Thr |
Val |
Trp |
Tyr |
|---|---|---|---|---|---|---|---|---|---|
2.833 ± 0.289 | 3.234 ± 0.324 |
4.356 ± 0.434 | 3.768 ± 0.49 |
6.2 ± 0.873 | 6.387 ± 0.781 |
5.746 ± 0.26 | 8.605 ± 0.984 |
1.256 ± 0.358 | 2.993 ± 0.358 |
Most of the basic statistics you can see at this page can be downloaded from this CSV file
See this proteome in:

Proteome-pI is available under Creative Commons Attribution-NoDerivs license, for more details see here
| Reference: Kozlowski LP. Proteome-pI 2.0: Proteome Isoelectric Point Database Update. Nucleic Acids Res. 2021, doi: 10.1093/nar/gkab944 | Contact: Lukasz P. Kozlowski |