Capybara microvirus Cap3_SP_333
Taxonomy: Viruses; Monodnaviria; Sangervirae; Phixviricota; Malgrandaviricetes; Petitvirales; Microviridae; unclassified Microviridae
Average proteome isoelectric point is 5.9
Get precalculated fractions of proteins
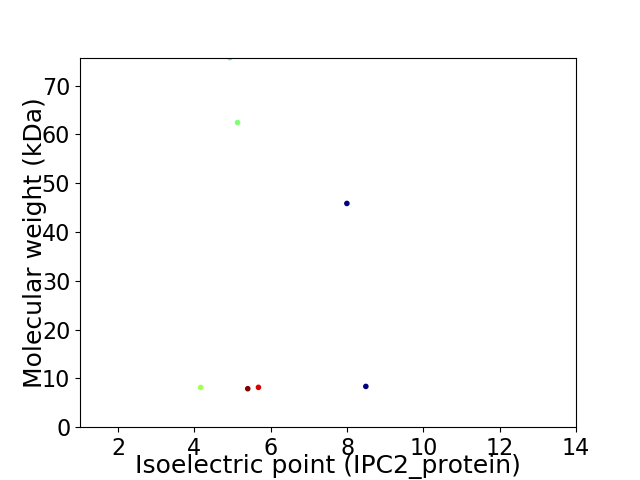
Virtual 2D-PAGE plot for 7 proteins (isoelectric point calculated using IPC2_protein)
Get csv file with sequences according to given criteria:
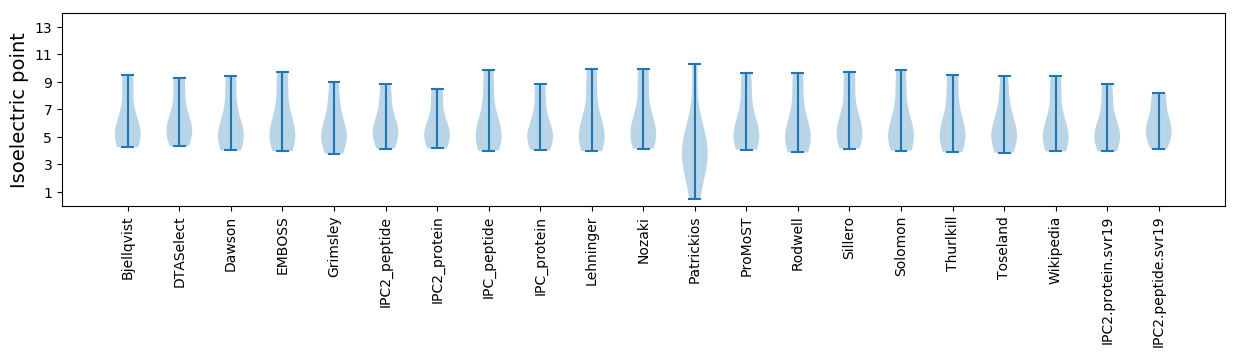
* You can choose from 21 different methods for calculating isoelectric point
Summary statistics related to proteome-wise predictions
Protein with the lowest isoelectric point:
>tr|A0A4P8W563|A0A4P8W563_9VIRU Minor capsid protein OS=Capybara microvirus Cap3_SP_333 OX=2585431 PE=4 SV=1
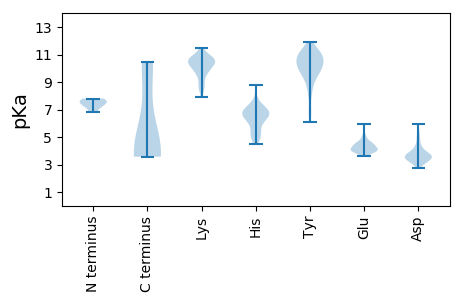
MM1 pKa = 7.53IIFYY5 pKa = 10.69VFLHH9 pKa = 5.99IKK11 pKa = 9.54IFNAMLFYY19 pKa = 11.11KK20 pKa = 10.34LFIEE24 pKa = 5.89FSSQTDD30 pKa = 3.67SFNEE34 pKa = 4.18EE35 pKa = 3.75YY36 pKa = 10.71DD37 pKa = 3.61FSSFEE42 pKa = 4.04DD43 pKa = 3.57AVAYY47 pKa = 10.6LSDD50 pKa = 3.61IASHH54 pKa = 6.9FLITNVKK61 pKa = 8.9IDD63 pKa = 3.81SYY65 pKa = 11.88YY66 pKa = 10.99EE67 pKa = 3.88DD68 pKa = 3.57
MM1 pKa = 7.53IIFYY5 pKa = 10.69VFLHH9 pKa = 5.99IKK11 pKa = 9.54IFNAMLFYY19 pKa = 11.11KK20 pKa = 10.34LFIEE24 pKa = 5.89FSSQTDD30 pKa = 3.67SFNEE34 pKa = 4.18EE35 pKa = 3.75YY36 pKa = 10.71DD37 pKa = 3.61FSSFEE42 pKa = 4.04DD43 pKa = 3.57AVAYY47 pKa = 10.6LSDD50 pKa = 3.61IASHH54 pKa = 6.9FLITNVKK61 pKa = 8.9IDD63 pKa = 3.81SYY65 pKa = 11.88YY66 pKa = 10.99EE67 pKa = 3.88DD68 pKa = 3.57
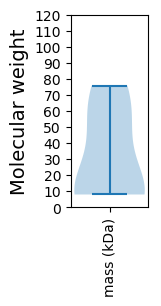
Molecular weight: 8.15 kDa
Isoelectric point according different methods:
Protein with the highest isoelectric point:
>tr|A0A4P8W8D2|A0A4P8W8D2_9VIRU Uncharacterized protein OS=Capybara microvirus Cap3_SP_333 OX=2585431 PE=4 SV=1
MM1 pKa = 6.81EE2 pKa = 5.94TINKK6 pKa = 8.92FLDD9 pKa = 3.35WLRR12 pKa = 11.84GLPIWVRR19 pKa = 11.84AVACLLAAAAIFLISLQSCSSVRR42 pKa = 11.84VVGNTADD49 pKa = 3.16SRR51 pKa = 11.84VTVRR55 pKa = 11.84QSALDD60 pKa = 3.54STRR63 pKa = 11.84ITIDD67 pKa = 2.97VLPNFNVNKK76 pKa = 10.46
MM1 pKa = 6.81EE2 pKa = 5.94TINKK6 pKa = 8.92FLDD9 pKa = 3.35WLRR12 pKa = 11.84GLPIWVRR19 pKa = 11.84AVACLLAAAAIFLISLQSCSSVRR42 pKa = 11.84VVGNTADD49 pKa = 3.16SRR51 pKa = 11.84VTVRR55 pKa = 11.84QSALDD60 pKa = 3.54STRR63 pKa = 11.84ITIDD67 pKa = 2.97VLPNFNVNKK76 pKa = 10.46
Molecular weight: 8.36 kDa
Isoelectric point according different methods:
Peptides (in silico digests for buttom-up proteomics)
Below you can find in silico digests of the whole proteome with Trypsin, Chymotrypsin, Trypsin+LysC, LysN, ArgC proteases suitable for different mass spec machines.| Try ESI |
 |
|---|
| ChTry ESI |
|
|---|
| ArgC ESI |
|
|---|
| LysN ESI |
|
|---|
| TryLysC ESI |
|
|---|
| Try MALDI |
|
|---|
| ChTry MALDI |
|
|---|
| ArgC MALDI |
|
|---|
| LysN MALDI |
|
|---|
| TryLysC MALDI |
|
|---|
| Try LTQ |
|
|---|
| ChTry LTQ |
|
|---|
| ArgC LTQ |
|
|---|
| LysN LTQ |
|
|---|
| TryLysC LTQ |
|
|---|
| Try MSlow |
|
|---|
| ChTry MSlow |
|
|---|
| ArgC MSlow |
|
|---|
| LysN MSlow |
|
|---|
| TryLysC MSlow |
|
|---|
| Try MShigh |
|
|---|
| ChTry MShigh |
|
|---|
| ArgC MShigh |
|
|---|
| LysN MShigh |
|
|---|
| TryLysC MShigh |
|
|---|
General Statistics
Number of major isoforms |
Number of additional isoforms |
Number of all proteins |
Number of amino acids |
Min. Seq. Length |
Max. Seq. Length |
Avg. Seq. Length |
Avg. Mol. Weight |
|---|---|---|---|---|---|---|---|
0 |
1902 |
68 |
661 |
271.7 |
30.95 |
Amino acid frequency
Ala |
Cys |
Asp |
Glu |
Phe |
Gly |
His |
Ile |
Lys |
Leu |
|---|---|---|---|---|---|---|---|---|---|
6.204 ± 1.216 | 1.577 ± 0.472 |
6.94 ± 0.402 | 4.154 ± 0.481 |
6.625 ± 1.01 | 5.205 ± 0.59 |
2.05 ± 0.695 | 5.994 ± 0.247 |
4.469 ± 0.334 | 9.464 ± 0.598 |
Met |
Asn |
Gln |
Pro |
Arg |
Ser |
Thr |
Val |
Trp |
Tyr |
|---|---|---|---|---|---|---|---|---|---|
1.788 ± 0.131 | 4.837 ± 0.598 |
3.785 ± 0.741 | 5.363 ± 1.398 |
5.1 ± 0.513 | 9.937 ± 0.544 |
4.732 ± 0.288 | 5.678 ± 0.294 |
1.262 ± 0.168 | 4.837 ± 0.57 |
Most of the basic statistics you can see at this page can be downloaded from this CSV file
See this proteome in:

Proteome-pI is available under Creative Commons Attribution-NoDerivs license, for more details see here
| Reference: Kozlowski LP. Proteome-pI 2.0: Proteome Isoelectric Point Database Update. Nucleic Acids Res. 2021, doi: 10.1093/nar/gkab944 | Contact: Lukasz P. Kozlowski |