Novosphingobium sp. Rr 2-17
Taxonomy: cellular organisms; Bacteria; Proteobacteria; Alphaproteobacteria; Sphingomonadales; Sphingomonadaceae; Novosphingobium; unclassified Novosphingobium
Average proteome isoelectric point is 6.6
Get precalculated fractions of proteins
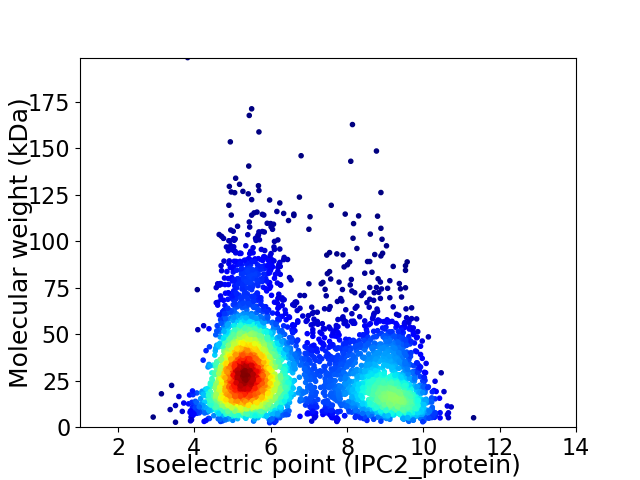
Virtual 2D-PAGE plot for 4301 proteins (isoelectric point calculated using IPC2_protein)
Get csv file with sequences according to given criteria:
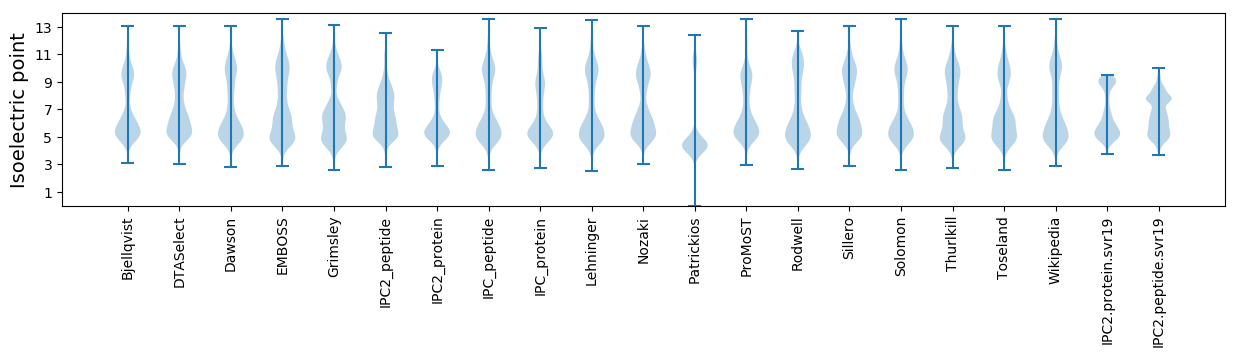
* You can choose from 21 different methods for calculating isoelectric point
Summary statistics related to proteome-wise predictions
Protein with the lowest isoelectric point:
>tr|I9WLG0|I9WLG0_9SPHN RNA 3'-terminal phosphate cyclase OS=Novosphingobium sp. Rr 2-17 OX=555793 GN=rtcA PE=3 SV=1
MM1 pKa = 8.1RR2 pKa = 11.84STHH5 pKa = 5.44QDD7 pKa = 2.66ASVRR11 pKa = 11.84LYY13 pKa = 10.78HH14 pKa = 7.32LDD16 pKa = 3.7GGPEE20 pKa = 3.87GGMATTLFYY29 pKa = 11.29GPLAQAMMIAAAEE42 pKa = 4.06PEE44 pKa = 4.32EE45 pKa = 4.18VQEE48 pKa = 4.39GLFLATDD55 pKa = 3.86NDD57 pKa = 3.68VVAYY61 pKa = 10.78LDD63 pKa = 4.43LLDD66 pKa = 4.06GG67 pKa = 4.45
MM1 pKa = 8.1RR2 pKa = 11.84STHH5 pKa = 5.44QDD7 pKa = 2.66ASVRR11 pKa = 11.84LYY13 pKa = 10.78HH14 pKa = 7.32LDD16 pKa = 3.7GGPEE20 pKa = 3.87GGMATTLFYY29 pKa = 11.29GPLAQAMMIAAAEE42 pKa = 4.06PEE44 pKa = 4.32EE45 pKa = 4.18VQEE48 pKa = 4.39GLFLATDD55 pKa = 3.86NDD57 pKa = 3.68VVAYY61 pKa = 10.78LDD63 pKa = 4.43LLDD66 pKa = 4.06GG67 pKa = 4.45
Molecular weight: 7.19 kDa
Isoelectric point according different methods:
Protein with the highest isoelectric point:
>tr|I9CB11|I9CB11_9SPHN Glutamate 5-kinase OS=Novosphingobium sp. Rr 2-17 OX=555793 GN=proB PE=3 SV=1
MM1 pKa = 7.45KK2 pKa = 9.56RR3 pKa = 11.84TFQPSRR9 pKa = 11.84LVRR12 pKa = 11.84ARR14 pKa = 11.84RR15 pKa = 11.84HH16 pKa = 4.46GFRR19 pKa = 11.84ARR21 pKa = 11.84GATVGGRR28 pKa = 11.84KK29 pKa = 8.2VLRR32 pKa = 11.84ARR34 pKa = 11.84RR35 pKa = 11.84ARR37 pKa = 11.84GRR39 pKa = 11.84KK40 pKa = 9.02KK41 pKa = 10.61LSAA44 pKa = 4.03
MM1 pKa = 7.45KK2 pKa = 9.56RR3 pKa = 11.84TFQPSRR9 pKa = 11.84LVRR12 pKa = 11.84ARR14 pKa = 11.84RR15 pKa = 11.84HH16 pKa = 4.46GFRR19 pKa = 11.84ARR21 pKa = 11.84GATVGGRR28 pKa = 11.84KK29 pKa = 8.2VLRR32 pKa = 11.84ARR34 pKa = 11.84RR35 pKa = 11.84ARR37 pKa = 11.84GRR39 pKa = 11.84KK40 pKa = 9.02KK41 pKa = 10.61LSAA44 pKa = 4.03
Molecular weight: 5.07 kDa
Isoelectric point according different methods:
Peptides (in silico digests for buttom-up proteomics)
Below you can find in silico digests of the whole proteome with Trypsin, Chymotrypsin, Trypsin+LysC, LysN, ArgC proteases suitable for different mass spec machines.| Try ESI |
 |
|---|
| ChTry ESI |
|
|---|
| ArgC ESI |
|
|---|
| LysN ESI |
|
|---|
| TryLysC ESI |
|
|---|
| Try MALDI |
|
|---|
| ChTry MALDI |
|
|---|
| ArgC MALDI |
|
|---|
| LysN MALDI |
|
|---|
| TryLysC MALDI |
|
|---|
| Try LTQ |
|
|---|
| ChTry LTQ |
|
|---|
| ArgC LTQ |
|
|---|
| LysN LTQ |
|
|---|
| TryLysC LTQ |
|
|---|
| Try MSlow |
|
|---|
| ChTry MSlow |
|
|---|
| ArgC MSlow |
|
|---|
| LysN MSlow |
|
|---|
| TryLysC MSlow |
|
|---|
| Try MShigh |
|
|---|
| ChTry MShigh |
|
|---|
| ArgC MShigh |
|
|---|
| LysN MShigh |
|
|---|
| TryLysC MShigh |
|
|---|
General Statistics
Number of major isoforms |
Number of additional isoforms |
Number of all proteins |
Number of amino acids |
Min. Seq. Length |
Max. Seq. Length |
Avg. Seq. Length |
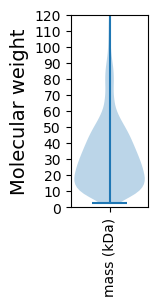
Avg. Mol. Weight |
|---|---|---|---|---|---|---|---|
0 |
1333011 |
22 |
2078 |
309.9 |
33.5 |
Amino acid frequency
Ala |
Cys |
Asp |
Glu |
Phe |
Gly |
His |
Ile |
Lys |
Leu |
|---|---|---|---|---|---|---|---|---|---|
12.946 ± 0.056 | 0.818 ± 0.011 |
5.813 ± 0.029 | 5.217 ± 0.033 |
3.496 ± 0.019 | 8.727 ± 0.043 |
2.042 ± 0.018 | 4.96 ± 0.027 |
3.117 ± 0.032 | 9.947 ± 0.045 |
Met |
Asn |
Gln |
Pro |
Arg |
Ser |
Thr |
Val |
Trp |
Tyr |
|---|---|---|---|---|---|---|---|---|---|
2.371 ± 0.017 | 2.639 ± 0.027 |
5.295 ± 0.031 | 3.318 ± 0.022 |
7.078 ± 0.041 | 5.628 ± 0.032 |
5.534 ± 0.031 | 7.284 ± 0.025 |
1.426 ± 0.016 | 2.345 ± 0.029 |
Most of the basic statistics you can see at this page can be downloaded from this CSV file
See this proteome in:

Proteome-pI is available under Creative Commons Attribution-NoDerivs license, for more details see here
| Reference: Kozlowski LP. Proteome-pI 2.0: Proteome Isoelectric Point Database Update. Nucleic Acids Res. 2021, doi: 10.1093/nar/gkab944 | Contact: Lukasz P. Kozlowski |