Salmonella phage vB_SenS_SB28
Taxonomy: Viruses; Duplodnaviria; Heunggongvirae; Uroviricota; Caudoviricetes; Caudovirales; Siphoviridae; unclassified Siphoviridae
Average proteome isoelectric point is 6.67
Get precalculated fractions of proteins
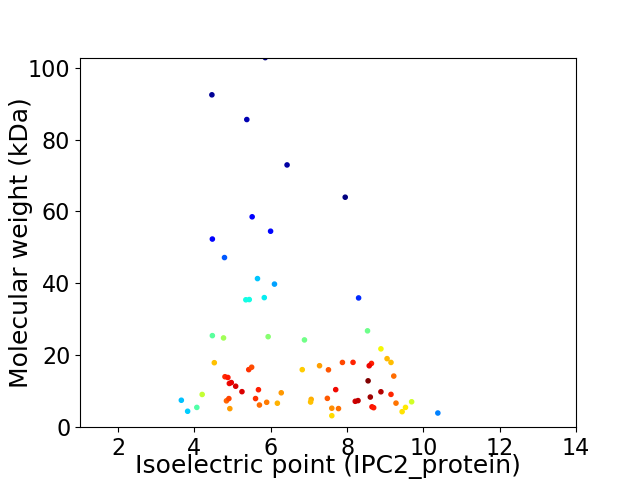
Virtual 2D-PAGE plot for 73 proteins (isoelectric point calculated using IPC2_protein)
Get csv file with sequences according to given criteria:
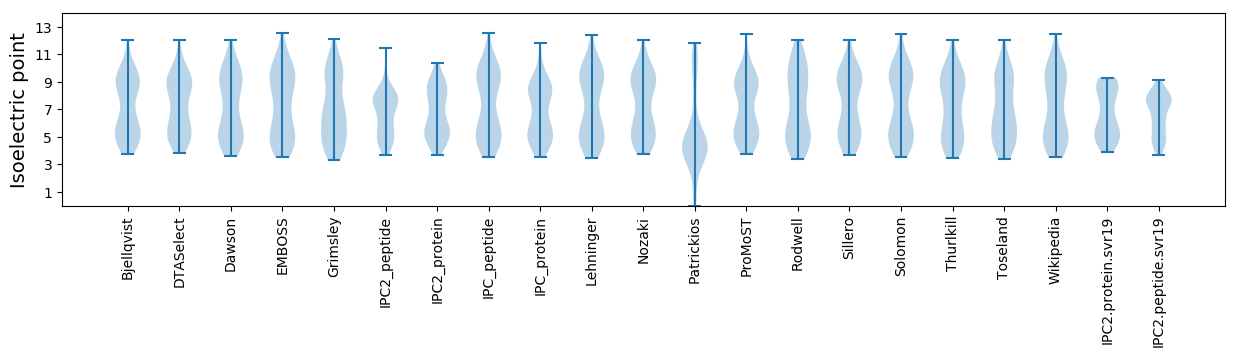
* You can choose from 21 different methods for calculating isoelectric point
Summary statistics related to proteome-wise predictions
Protein with the lowest isoelectric point:
>tr|A0A5J6TA29|A0A5J6TA29_9CAUD Uncharacterized protein OS=Salmonella phage vB_SenS_SB28 OX=2591136 PE=4 SV=1
MM1 pKa = 7.52SEE3 pKa = 3.88NPANLVCVKK12 pKa = 10.82SKK14 pKa = 10.84IPWFKK19 pKa = 10.85DD20 pKa = 2.65GCSYY24 pKa = 9.49ITYY27 pKa = 10.59SDD29 pKa = 3.99LNYY32 pKa = 10.84DD33 pKa = 3.68YY34 pKa = 11.72VLDD37 pKa = 3.91EE38 pKa = 5.57DD39 pKa = 4.57GNEE42 pKa = 3.94FVIDD46 pKa = 3.65QFGDD50 pKa = 3.72CEE52 pKa = 4.28FGVFDD57 pKa = 4.57GGLVASFVLPP67 pKa = 3.98
MM1 pKa = 7.52SEE3 pKa = 3.88NPANLVCVKK12 pKa = 10.82SKK14 pKa = 10.84IPWFKK19 pKa = 10.85DD20 pKa = 2.65GCSYY24 pKa = 9.49ITYY27 pKa = 10.59SDD29 pKa = 3.99LNYY32 pKa = 10.84DD33 pKa = 3.68YY34 pKa = 11.72VLDD37 pKa = 3.91EE38 pKa = 5.57DD39 pKa = 4.57GNEE42 pKa = 3.94FVIDD46 pKa = 3.65QFGDD50 pKa = 3.72CEE52 pKa = 4.28FGVFDD57 pKa = 4.57GGLVASFVLPP67 pKa = 3.98
Molecular weight: 7.5 kDa
Isoelectric point according different methods:
Protein with the highest isoelectric point:
>tr|A0A5J6TB42|A0A5J6TB42_9CAUD Uncharacterized protein OS=Salmonella phage vB_SenS_SB28 OX=2591136 PE=4 SV=1
MM1 pKa = 7.56AKK3 pKa = 10.17VIYY6 pKa = 9.95RR7 pKa = 11.84RR8 pKa = 11.84EE9 pKa = 3.92NLEE12 pKa = 3.92QEE14 pKa = 4.37LGPVGTQNFMSKK26 pKa = 9.68RR27 pKa = 11.84ARR29 pKa = 11.84KK30 pKa = 9.03AMEE33 pKa = 4.37SIRR36 pKa = 11.84VNRR39 pKa = 11.84VVRR42 pKa = 11.84VFNGEE47 pKa = 3.69GKK49 pKa = 10.08RR50 pKa = 11.84RR51 pKa = 11.84VMDD54 pKa = 3.54EE55 pKa = 4.36LIIVFF60 pKa = 4.5
MM1 pKa = 7.56AKK3 pKa = 10.17VIYY6 pKa = 9.95RR7 pKa = 11.84RR8 pKa = 11.84EE9 pKa = 3.92NLEE12 pKa = 3.92QEE14 pKa = 4.37LGPVGTQNFMSKK26 pKa = 9.68RR27 pKa = 11.84ARR29 pKa = 11.84KK30 pKa = 9.03AMEE33 pKa = 4.37SIRR36 pKa = 11.84VNRR39 pKa = 11.84VVRR42 pKa = 11.84VFNGEE47 pKa = 3.69GKK49 pKa = 10.08RR50 pKa = 11.84RR51 pKa = 11.84VMDD54 pKa = 3.54EE55 pKa = 4.36LIIVFF60 pKa = 4.5
Molecular weight: 7.07 kDa
Isoelectric point according different methods:
Peptides (in silico digests for buttom-up proteomics)
Below you can find in silico digests of the whole proteome with Trypsin, Chymotrypsin, Trypsin+LysC, LysN, ArgC proteases suitable for different mass spec machines.| Try ESI |
 |
|---|
| ChTry ESI |
|
|---|
| ArgC ESI |
|
|---|
| LysN ESI |
|
|---|
| TryLysC ESI |
|
|---|
| Try MALDI |
|
|---|
| ChTry MALDI |
|
|---|
| ArgC MALDI |
|
|---|
| LysN MALDI |
|
|---|
| TryLysC MALDI |
|
|---|
| Try LTQ |
|
|---|
| ChTry LTQ |
|
|---|
| ArgC LTQ |
|
|---|
| LysN LTQ |
|
|---|
| TryLysC LTQ |
|
|---|
| Try MSlow |
|
|---|
| ChTry MSlow |
|
|---|
| ArgC MSlow |
|
|---|
| LysN MSlow |
|
|---|
| TryLysC MSlow |
|
|---|
| Try MShigh |
|
|---|
| ChTry MShigh |
|
|---|
| ArgC MShigh |
|
|---|
| LysN MShigh |
|
|---|
| TryLysC MShigh |
|
|---|
General Statistics
Number of major isoforms |
Number of additional isoforms |
Number of all proteins |
Number of amino acids |
Min. Seq. Length |
Max. Seq. Length |
Avg. Seq. Length |
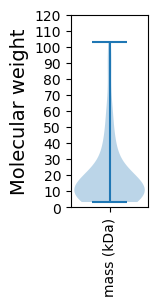
Avg. Mol. Weight |
|---|---|---|---|---|---|---|---|
0 |
13672 |
31 |
980 |
187.3 |
21.0 |
Amino acid frequency
Ala |
Cys |
Asp |
Glu |
Phe |
Gly |
His |
Ile |
Lys |
Leu |
|---|---|---|---|---|---|---|---|---|---|
8.66 ± 0.587 | 1.448 ± 0.204 |
6.159 ± 0.267 | 6.824 ± 0.287 |
3.467 ± 0.153 | 7.022 ± 0.267 |
1.865 ± 0.204 | 6.363 ± 0.216 |
6.539 ± 0.327 | 7.014 ± 0.188 |
Met |
Asn |
Gln |
Pro |
Arg |
Ser |
Thr |
Val |
Trp |
Tyr |
|---|---|---|---|---|---|---|---|---|---|
3.13 ± 0.196 | 4.849 ± 0.241 |
3.174 ± 0.248 | 3.986 ± 0.378 |
5.508 ± 0.252 | 6.532 ± 0.312 |
5.449 ± 0.376 | 6.641 ± 0.23 |
1.529 ± 0.114 | 3.833 ± 0.206 |
Most of the basic statistics you can see at this page can be downloaded from this CSV file
See this proteome in:

Proteome-pI is available under Creative Commons Attribution-NoDerivs license, for more details see here
| Reference: Kozlowski LP. Proteome-pI 2.0: Proteome Isoelectric Point Database Update. Nucleic Acids Res. 2021, doi: 10.1093/nar/gkab944 | Contact: Lukasz P. Kozlowski |