Micromonospora deserti
Taxonomy: cellular organisms; Bacteria; Terrabacteria group; Actinobacteria; Actinomycetia; Micromonosporales; Micromonosporaceae; Micromonospora
Average proteome isoelectric point is 6.69
Get precalculated fractions of proteins
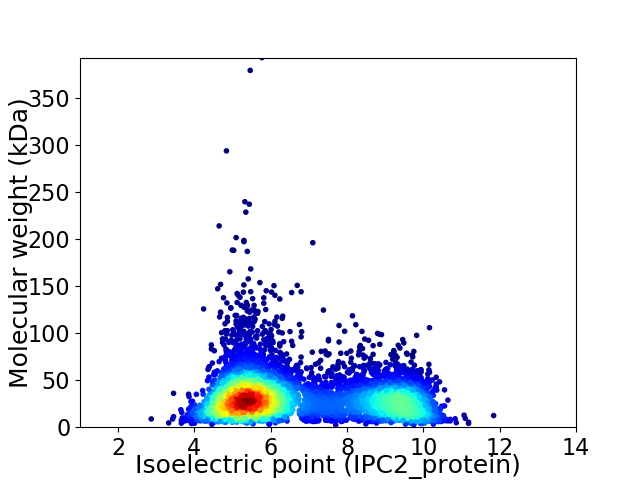
Virtual 2D-PAGE plot for 5968 proteins (isoelectric point calculated using IPC2_protein)
Get csv file with sequences according to given criteria:
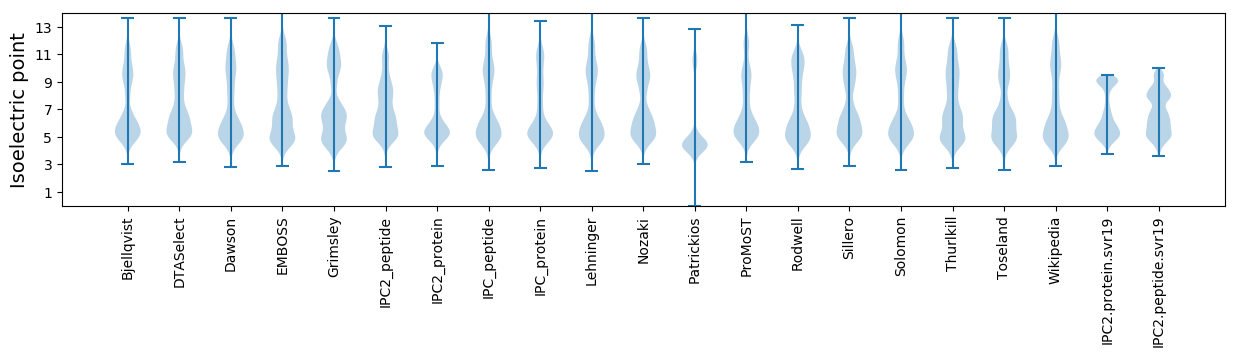
* You can choose from 21 different methods for calculating isoelectric point
Summary statistics related to proteome-wise predictions
Protein with the lowest isoelectric point:
>tr|A0A2W2D764|A0A2W2D764_9ACTN Condensation protein OS=Micromonospora deserti OX=2070366 GN=C1I99_17105 PE=4 SV=1
MM1 pKa = 7.24QLGALTALALALSGCNLTSDD21 pKa = 5.66DD22 pKa = 5.64DD23 pKa = 6.32DD24 pKa = 5.69DD25 pKa = 5.63DD26 pKa = 4.71CALGPVGGGGTVALALRR43 pKa = 11.84APEE46 pKa = 4.17PAAPTAGEE54 pKa = 3.94PAAAAVPEE62 pKa = 4.1RR63 pKa = 11.84GGFGTHH69 pKa = 6.99LAACGGG75 pKa = 3.7
MM1 pKa = 7.24QLGALTALALALSGCNLTSDD21 pKa = 5.66DD22 pKa = 5.64DD23 pKa = 6.32DD24 pKa = 5.69DD25 pKa = 5.63DD26 pKa = 4.71CALGPVGGGGTVALALRR43 pKa = 11.84APEE46 pKa = 4.17PAAPTAGEE54 pKa = 3.94PAAAAVPEE62 pKa = 4.1RR63 pKa = 11.84GGFGTHH69 pKa = 6.99LAACGGG75 pKa = 3.7
Molecular weight: 7.02 kDa
Isoelectric point according different methods:
Protein with the highest isoelectric point:
>tr|A0A2W2DB67|A0A2W2DB67_9ACTN DUF2267 domain-containing protein OS=Micromonospora deserti OX=2070366 GN=C1I99_02385 PE=4 SV=1
MM1 pKa = 7.28GSVVKK6 pKa = 10.49KK7 pKa = 9.45RR8 pKa = 11.84RR9 pKa = 11.84KK10 pKa = 9.48RR11 pKa = 11.84MAKK14 pKa = 9.41KK15 pKa = 9.87KK16 pKa = 9.7HH17 pKa = 5.84RR18 pKa = 11.84KK19 pKa = 8.7LLRR22 pKa = 11.84KK23 pKa = 7.84TRR25 pKa = 11.84VQRR28 pKa = 11.84RR29 pKa = 11.84RR30 pKa = 11.84LGKK33 pKa = 10.04
MM1 pKa = 7.28GSVVKK6 pKa = 10.49KK7 pKa = 9.45RR8 pKa = 11.84RR9 pKa = 11.84KK10 pKa = 9.48RR11 pKa = 11.84MAKK14 pKa = 9.41KK15 pKa = 9.87KK16 pKa = 9.7HH17 pKa = 5.84RR18 pKa = 11.84KK19 pKa = 8.7LLRR22 pKa = 11.84KK23 pKa = 7.84TRR25 pKa = 11.84VQRR28 pKa = 11.84RR29 pKa = 11.84RR30 pKa = 11.84LGKK33 pKa = 10.04
Molecular weight: 4.12 kDa
Isoelectric point according different methods:
Peptides (in silico digests for buttom-up proteomics)
Below you can find in silico digests of the whole proteome with Trypsin, Chymotrypsin, Trypsin+LysC, LysN, ArgC proteases suitable for different mass spec machines.| Try ESI |
 |
|---|
| ChTry ESI |
|
|---|
| ArgC ESI |
|
|---|
| LysN ESI |
|
|---|
| TryLysC ESI |
|
|---|
| Try MALDI |
|
|---|
| ChTry MALDI |
|
|---|
| ArgC MALDI |
|
|---|
| LysN MALDI |
|
|---|
| TryLysC MALDI |
|
|---|
| Try LTQ |
|
|---|
| ChTry LTQ |
|
|---|
| ArgC LTQ |
|
|---|
| LysN LTQ |
|
|---|
| TryLysC LTQ |
|
|---|
| Try MSlow |
|
|---|
| ChTry MSlow |
|
|---|
| ArgC MSlow |
|
|---|
| LysN MSlow |
|
|---|
| TryLysC MSlow |
|
|---|
| Try MShigh |
|
|---|
| ChTry MShigh |
|
|---|
| ArgC MShigh |
|
|---|
| LysN MShigh |
|
|---|
| TryLysC MShigh |
|
|---|
General Statistics
Number of major isoforms |
Number of additional isoforms |
Number of all proteins |
Number of amino acids |
Min. Seq. Length |
Max. Seq. Length |
Avg. Seq. Length |
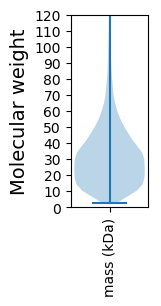
Avg. Mol. Weight |
|---|---|---|---|---|---|---|---|
0 |
1882724 |
22 |
3718 |
315.5 |
33.71 |
Amino acid frequency
Ala |
Cys |
Asp |
Glu |
Phe |
Gly |
His |
Ile |
Lys |
Leu |
|---|---|---|---|---|---|---|---|---|---|
14.136 ± 0.049 | 0.754 ± 0.01 |
5.963 ± 0.026 | 5.008 ± 0.03 |
2.679 ± 0.019 | 9.513 ± 0.032 |
2.143 ± 0.017 | 3.164 ± 0.022 |
1.618 ± 0.023 | 10.449 ± 0.043 |
Met |
Asn |
Gln |
Pro |
Arg |
Ser |
Thr |
Val |
Trp |
Tyr |
|---|---|---|---|---|---|---|---|---|---|
1.597 ± 0.012 | 1.842 ± 0.02 |
6.371 ± 0.028 | 2.683 ± 0.017 |
8.556 ± 0.036 | 4.578 ± 0.024 |
6.073 ± 0.03 | 9.113 ± 0.035 |
1.629 ± 0.014 | 2.131 ± 0.018 |
Most of the basic statistics you can see at this page can be downloaded from this CSV file
See this proteome in:

Proteome-pI is available under Creative Commons Attribution-NoDerivs license, for more details see here
| Reference: Kozlowski LP. Proteome-pI 2.0: Proteome Isoelectric Point Database Update. Nucleic Acids Res. 2021, doi: 10.1093/nar/gkab944 | Contact: Lukasz P. Kozlowski |