Monilinia laxa
Taxonomy: cellular organisms; Eukaryota; Opisthokonta; Fungi; Dikarya; Ascomycota; saccharomyceta; Pezizomycotina; leotiomyceta; sordariomyceta; Leotiomycetes; Helotiales; Sclerotiniaceae; Monilinia
Average proteome isoelectric point is 6.67
Get precalculated fractions of proteins
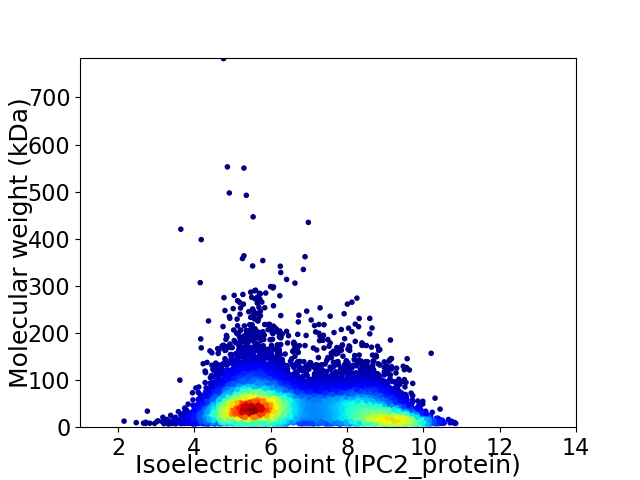
Virtual 2D-PAGE plot for 12416 proteins (isoelectric point calculated using IPC2_protein)
Get csv file with sequences according to given criteria:
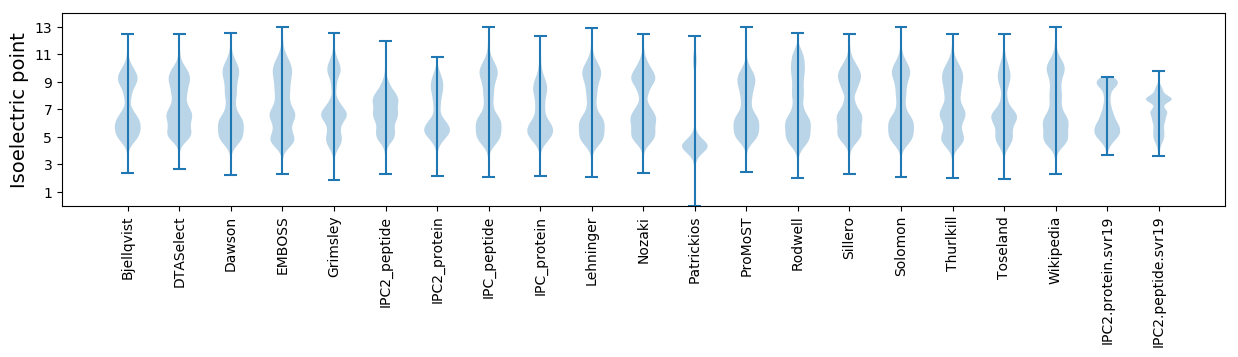
* You can choose from 21 different methods for calculating isoelectric point
Summary statistics related to proteome-wise predictions
Protein with the lowest isoelectric point:
>tr|A0A5N6KG37|A0A5N6KG37_9HELO Uncharacterized protein OS=Monilinia laxa OX=61186 GN=EYC80_006093 PE=3 SV=1
MM1 pKa = 7.15VLPVFVFLPLYY12 pKa = 8.13MYY14 pKa = 9.7PYY16 pKa = 10.98NSTSWSTLTTSIVSNPNLKK35 pKa = 9.85FHH37 pKa = 6.44VVVSPNLAFTDD48 pKa = 3.5PDD50 pKa = 3.57ANYY53 pKa = 10.32VAGISILKK61 pKa = 9.61SHH63 pKa = 6.93ANVLTLGYY71 pKa = 10.5VYY73 pKa = 10.4TSYY76 pKa = 11.64GLRR79 pKa = 11.84DD80 pKa = 3.42ISEE83 pKa = 3.98IEE85 pKa = 3.67ADD87 pKa = 3.1INKK90 pKa = 9.45YY91 pKa = 10.4VGWNKK96 pKa = 9.57PAEE99 pKa = 4.16IPVDD103 pKa = 4.09GIFFDD108 pKa = 4.63EE109 pKa = 4.55SPSNNSTFSYY119 pKa = 10.1MSTLSSYY126 pKa = 11.73AKK128 pKa = 9.77TSLGAGKK135 pKa = 10.09DD136 pKa = 3.83YY137 pKa = 11.21IFLNPGVPVDD147 pKa = 3.51ASFYY151 pKa = 10.46TLADD155 pKa = 3.88SINVFEE161 pKa = 4.28EE162 pKa = 4.89SYY164 pKa = 11.87AKK166 pKa = 10.44FNKK169 pKa = 8.87TALNSLDD176 pKa = 3.42KK177 pKa = 10.8TLLAKK182 pKa = 9.18STYY185 pKa = 10.11AIHH188 pKa = 7.3DD189 pKa = 3.88FKK191 pKa = 11.33GTVAQQIDD199 pKa = 5.48LISQLASANLAGILITTQPGYY220 pKa = 10.98AVWSSLWSSFCSAVSRR236 pKa = 11.84LNLSGRR242 pKa = 11.84IGEE245 pKa = 4.51GGGNGDD251 pKa = 4.87GIGNDD256 pKa = 3.5GGYY259 pKa = 10.94GGGDD263 pKa = 4.2DD264 pKa = 6.02RR265 pKa = 11.84DD266 pKa = 4.82DD267 pKa = 6.41DD268 pKa = 6.57DD269 pKa = 7.77DD270 pKa = 7.58DD271 pKa = 7.55DD272 pKa = 6.71DD273 pKa = 6.2DD274 pKa = 6.0NSGNDD279 pKa = 4.11DD280 pKa = 4.79DD281 pKa = 6.74DD282 pKa = 7.21DD283 pKa = 6.59GDD285 pKa = 3.9EE286 pKa = 4.21EE287 pKa = 4.62TT288 pKa = 5.14
MM1 pKa = 7.15VLPVFVFLPLYY12 pKa = 8.13MYY14 pKa = 9.7PYY16 pKa = 10.98NSTSWSTLTTSIVSNPNLKK35 pKa = 9.85FHH37 pKa = 6.44VVVSPNLAFTDD48 pKa = 3.5PDD50 pKa = 3.57ANYY53 pKa = 10.32VAGISILKK61 pKa = 9.61SHH63 pKa = 6.93ANVLTLGYY71 pKa = 10.5VYY73 pKa = 10.4TSYY76 pKa = 11.64GLRR79 pKa = 11.84DD80 pKa = 3.42ISEE83 pKa = 3.98IEE85 pKa = 3.67ADD87 pKa = 3.1INKK90 pKa = 9.45YY91 pKa = 10.4VGWNKK96 pKa = 9.57PAEE99 pKa = 4.16IPVDD103 pKa = 4.09GIFFDD108 pKa = 4.63EE109 pKa = 4.55SPSNNSTFSYY119 pKa = 10.1MSTLSSYY126 pKa = 11.73AKK128 pKa = 9.77TSLGAGKK135 pKa = 10.09DD136 pKa = 3.83YY137 pKa = 11.21IFLNPGVPVDD147 pKa = 3.51ASFYY151 pKa = 10.46TLADD155 pKa = 3.88SINVFEE161 pKa = 4.28EE162 pKa = 4.89SYY164 pKa = 11.87AKK166 pKa = 10.44FNKK169 pKa = 8.87TALNSLDD176 pKa = 3.42KK177 pKa = 10.8TLLAKK182 pKa = 9.18STYY185 pKa = 10.11AIHH188 pKa = 7.3DD189 pKa = 3.88FKK191 pKa = 11.33GTVAQQIDD199 pKa = 5.48LISQLASANLAGILITTQPGYY220 pKa = 10.98AVWSSLWSSFCSAVSRR236 pKa = 11.84LNLSGRR242 pKa = 11.84IGEE245 pKa = 4.51GGGNGDD251 pKa = 4.87GIGNDD256 pKa = 3.5GGYY259 pKa = 10.94GGGDD263 pKa = 4.2DD264 pKa = 6.02RR265 pKa = 11.84DD266 pKa = 4.82DD267 pKa = 6.41DD268 pKa = 6.57DD269 pKa = 7.77DD270 pKa = 7.58DD271 pKa = 7.55DD272 pKa = 6.71DD273 pKa = 6.2DD274 pKa = 6.0NSGNDD279 pKa = 4.11DD280 pKa = 4.79DD281 pKa = 6.74DD282 pKa = 7.21DD283 pKa = 6.59GDD285 pKa = 3.9EE286 pKa = 4.21EE287 pKa = 4.62TT288 pKa = 5.14
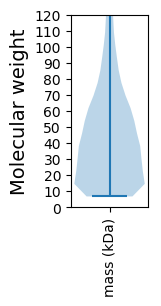
Molecular weight: 31.06 kDa
Isoelectric point according different methods:
Protein with the highest isoelectric point:
>tr|A0A5N6JNB2|A0A5N6JNB2_9HELO Uncharacterized protein OS=Monilinia laxa OX=61186 GN=EYC80_010279 PE=4 SV=1
MM1 pKa = 7.19LQKK4 pKa = 10.75KK5 pKa = 9.45HH6 pKa = 6.49LFTNNFLVSTQNISTKK22 pKa = 10.6SPTKK26 pKa = 10.47HH27 pKa = 5.18STHH30 pKa = 7.16PKK32 pKa = 10.47LKK34 pKa = 8.44MQTKK38 pKa = 9.98RR39 pKa = 11.84LVLNHH44 pKa = 6.29SLNLRR49 pKa = 11.84LPVFSTRR56 pKa = 11.84KK57 pKa = 9.34PKK59 pKa = 10.09ILRR62 pKa = 11.84SGTSQVWTT70 pKa = 4.02
MM1 pKa = 7.19LQKK4 pKa = 10.75KK5 pKa = 9.45HH6 pKa = 6.49LFTNNFLVSTQNISTKK22 pKa = 10.6SPTKK26 pKa = 10.47HH27 pKa = 5.18STHH30 pKa = 7.16PKK32 pKa = 10.47LKK34 pKa = 8.44MQTKK38 pKa = 9.98RR39 pKa = 11.84LVLNHH44 pKa = 6.29SLNLRR49 pKa = 11.84LPVFSTRR56 pKa = 11.84KK57 pKa = 9.34PKK59 pKa = 10.09ILRR62 pKa = 11.84SGTSQVWTT70 pKa = 4.02
Molecular weight: 8.12 kDa
Isoelectric point according different methods:
Peptides (in silico digests for buttom-up proteomics)
Below you can find in silico digests of the whole proteome with Trypsin, Chymotrypsin, Trypsin+LysC, LysN, ArgC proteases suitable for different mass spec machines.| Try ESI |
 |
|---|
| ChTry ESI |
|
|---|
| ArgC ESI |
|
|---|
| LysN ESI |
|
|---|
| TryLysC ESI |
|
|---|
| Try MALDI |
|
|---|
| ChTry MALDI |
|
|---|
| ArgC MALDI |
|
|---|
| LysN MALDI |
|
|---|
| TryLysC MALDI |
|
|---|
| Try LTQ |
|
|---|
| ChTry LTQ |
|
|---|
| ArgC LTQ |
|
|---|
| LysN LTQ |
|
|---|
| TryLysC LTQ |
|
|---|
| Try MSlow |
|
|---|
| ChTry MSlow |
|
|---|
| ArgC MSlow |
|
|---|
| LysN MSlow |
|
|---|
| TryLysC MSlow |
|
|---|
| Try MShigh |
|
|---|
| ChTry MShigh |
|
|---|
| ArgC MShigh |
|
|---|
| LysN MShigh |
|
|---|
| TryLysC MShigh |
|
|---|
General Statistics
Number of major isoforms |
Number of additional isoforms |
Number of all proteins |
Number of amino acids |
Min. Seq. Length |
Max. Seq. Length |
Avg. Seq. Length |
Avg. Mol. Weight |
|---|---|---|---|---|---|---|---|
5571812 |
66 |
7051 |
448.8 |
49.8 |
Amino acid frequency
Ala |
Cys |
Asp |
Glu |
Phe |
Gly |
His |
Ile |
Lys |
Leu |
|---|---|---|---|---|---|---|---|---|---|
7.598 ± 0.021 | 1.164 ± 0.009 |
5.479 ± 0.016 | 6.466 ± 0.028 |
3.754 ± 0.013 | 6.784 ± 0.022 |
2.35 ± 0.01 | 5.543 ± 0.014 |
5.46 ± 0.022 | 8.554 ± 0.025 |
Met |
Asn |
Gln |
Pro |
Arg |
Ser |
Thr |
Val |
Trp |
Tyr |
|---|---|---|---|---|---|---|---|---|---|
2.201 ± 0.01 | 4.269 ± 0.015 |
5.903 ± 0.023 | 3.925 ± 0.018 |
5.703 ± 0.019 | 8.858 ± 0.031 |
6.142 ± 0.019 | 5.654 ± 0.014 |
1.346 ± 0.008 | 2.844 ± 0.012 |
Most of the basic statistics you can see at this page can be downloaded from this CSV file
See this proteome in:

Proteome-pI is available under Creative Commons Attribution-NoDerivs license, for more details see here
| Reference: Kozlowski LP. Proteome-pI 2.0: Proteome Isoelectric Point Database Update. Nucleic Acids Res. 2021, doi: 10.1093/nar/gkab944 | Contact: Lukasz P. Kozlowski |