Fasciola gigantica (Giant liver fluke)
Taxonomy: cellular organisms; Eukaryota; Opisthokonta; Metazoa; Eumetazoa; Bilateria; Protostomia; Spiralia; Lophotrochozoa; Platyhelminthes; Trematoda; Digenea; Plagiorchiida; Echinostomata; Echinostomatoidea; Fasciolidae; Fasciola
Average proteome isoelectric point is 6.9
Get precalculated fractions of proteins
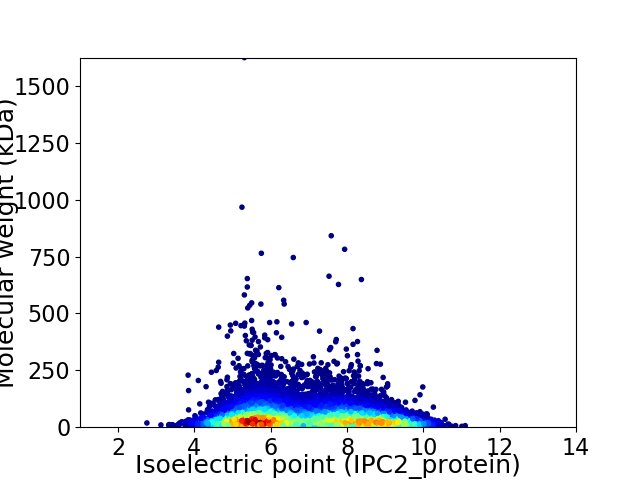
Virtual 2D-PAGE plot for 12643 proteins (isoelectric point calculated using IPC2_protein)
Get csv file with sequences according to given criteria:
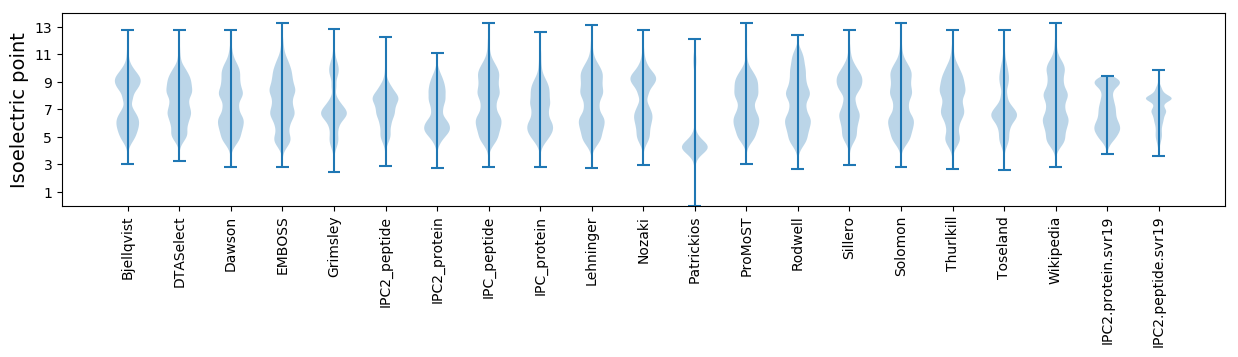
* You can choose from 21 different methods for calculating isoelectric point
Summary statistics related to proteome-wise predictions
Protein with the lowest isoelectric point:
>tr|A0A504YZH6|A0A504YZH6_FASGI Leucine rich repeat flightless interacting OS=Fasciola gigantica OX=46835 GN=FGIG_06733 PE=3 SV=1
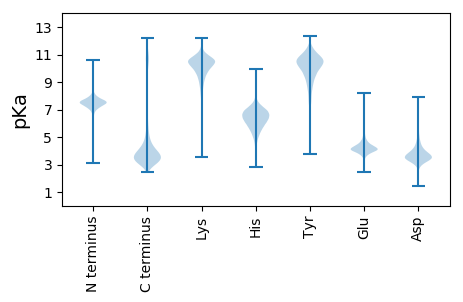
MM1 pKa = 7.29VSSFDD6 pKa = 5.48DD7 pKa = 4.08GAPDD11 pKa = 3.45YY12 pKa = 11.02KK13 pKa = 10.73CASRR17 pKa = 11.84DD18 pKa = 3.86LLCTALDD25 pKa = 3.45QGPVYY30 pKa = 9.25EE31 pKa = 4.64ASVASEE37 pKa = 3.92CWDD40 pKa = 3.06WGLTVPLRR48 pKa = 11.84EE49 pKa = 4.18TSS51 pKa = 3.11
MM1 pKa = 7.29VSSFDD6 pKa = 5.48DD7 pKa = 4.08GAPDD11 pKa = 3.45YY12 pKa = 11.02KK13 pKa = 10.73CASRR17 pKa = 11.84DD18 pKa = 3.86LLCTALDD25 pKa = 3.45QGPVYY30 pKa = 9.25EE31 pKa = 4.64ASVASEE37 pKa = 3.92CWDD40 pKa = 3.06WGLTVPLRR48 pKa = 11.84EE49 pKa = 4.18TSS51 pKa = 3.11
Molecular weight: 5.56 kDa
Isoelectric point according different methods:
Protein with the highest isoelectric point:
>tr|A0A504YQA8|A0A504YQA8_FASGI Uncharacterized protein OS=Fasciola gigantica OX=46835 GN=FGIG_04674 PE=4 SV=1
MM1 pKa = 6.63STGRR5 pKa = 11.84GGSMGPNTRR14 pKa = 11.84GGVGGRR20 pKa = 11.84GGRR23 pKa = 11.84GGMGPGGRR31 pKa = 11.84GGGTSMPRR39 pKa = 11.84RR40 pKa = 11.84GQQ42 pKa = 3.15
MM1 pKa = 6.63STGRR5 pKa = 11.84GGSMGPNTRR14 pKa = 11.84GGVGGRR20 pKa = 11.84GGRR23 pKa = 11.84GGMGPGGRR31 pKa = 11.84GGGTSMPRR39 pKa = 11.84RR40 pKa = 11.84GQQ42 pKa = 3.15
Molecular weight: 3.92 kDa
Isoelectric point according different methods:
Peptides (in silico digests for buttom-up proteomics)
Below you can find in silico digests of the whole proteome with Trypsin, Chymotrypsin, Trypsin+LysC, LysN, ArgC proteases suitable for different mass spec machines.| Try ESI |
 |
|---|
| ChTry ESI |
|
|---|
| ArgC ESI |
|
|---|
| LysN ESI |
|
|---|
| TryLysC ESI |
|
|---|
| Try MALDI |
|
|---|
| ChTry MALDI |
|
|---|
| ArgC MALDI |
|
|---|
| LysN MALDI |
|
|---|
| TryLysC MALDI |
|
|---|
| Try LTQ |
|
|---|
| ChTry LTQ |
|
|---|
| ArgC LTQ |
|
|---|
| LysN LTQ |
|
|---|
| TryLysC LTQ |
|
|---|
| Try MSlow |
|
|---|
| ChTry MSlow |
|
|---|
| ArgC MSlow |
|
|---|
| LysN MSlow |
|
|---|
| TryLysC MSlow |
|
|---|
| Try MShigh |
|
|---|
| ChTry MShigh |
|
|---|
| ArgC MShigh |
|
|---|
| LysN MShigh |
|
|---|
| TryLysC MShigh |
|
|---|
General Statistics
Number of major isoforms |
Number of additional isoforms |
Number of all proteins |
Number of amino acids |
Min. Seq. Length |
Max. Seq. Length |
Avg. Seq. Length |
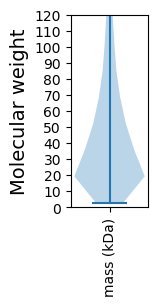
Avg. Mol. Weight |
|---|---|---|---|---|---|---|---|
0 |
5783738 |
24 |
14570 |
457.5 |
51.01 |
Amino acid frequency
Ala |
Cys |
Asp |
Glu |
Phe |
Gly |
His |
Ile |
Lys |
Leu |
|---|---|---|---|---|---|---|---|---|---|
6.697 ± 0.02 | 2.095 ± 0.013 |
5.187 ± 0.018 | 5.738 ± 0.028 |
3.67 ± 0.017 | 5.484 ± 0.028 |
2.774 ± 0.011 | 4.752 ± 0.015 |
4.346 ± 0.02 | 9.666 ± 0.029 |
Met |
Asn |
Gln |
Pro |
Arg |
Ser |
Thr |
Val |
Trp |
Tyr |
|---|---|---|---|---|---|---|---|---|---|
2.123 ± 0.008 | 4.316 ± 0.012 |
5.925 ± 0.027 | 4.363 ± 0.017 |
6.493 ± 0.019 | 9.696 ± 0.037 |
6.555 ± 0.019 | 6.365 ± 0.015 |
1.139 ± 0.007 | 2.609 ± 0.015 |
Most of the basic statistics you can see at this page can be downloaded from this CSV file
See this proteome in:

Proteome-pI is available under Creative Commons Attribution-NoDerivs license, for more details see here
| Reference: Kozlowski LP. Proteome-pI 2.0: Proteome Isoelectric Point Database Update. Nucleic Acids Res. 2021, doi: 10.1093/nar/gkab944 | Contact: Lukasz P. Kozlowski |