Salmonella phage SI8
Taxonomy: Viruses; Duplodnaviria; Heunggongvirae; Uroviricota; Caudoviricetes; Caudovirales; Podoviridae; Lederbergvirus; unclassified Lederbergvirus
Average proteome isoelectric point is 6.79
Get precalculated fractions of proteins
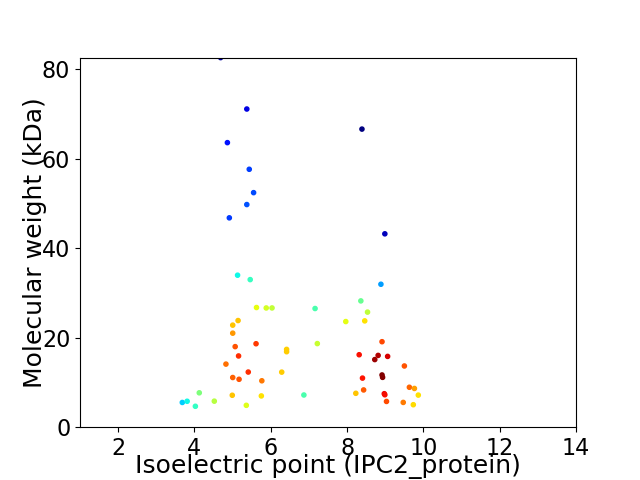
Virtual 2D-PAGE plot for 63 proteins (isoelectric point calculated using IPC2_protein)
Get csv file with sequences according to given criteria:
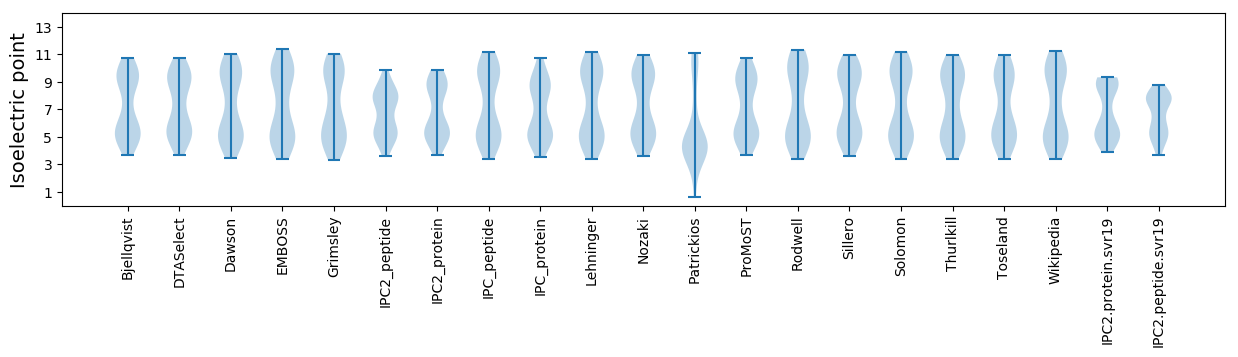
* You can choose from 21 different methods for calculating isoelectric point
Summary statistics related to proteome-wise predictions
Protein with the lowest isoelectric point:
>tr|A0A5C0CAQ8|A0A5C0CAQ8_9CAUD Regulatory protein Cro OS=Salmonella phage SI8 OX=2592213 PE=4 SV=1
MM1 pKa = 7.26LHH3 pKa = 7.23DD4 pKa = 4.7FDD6 pKa = 6.33DD7 pKa = 4.44EE8 pKa = 4.22EE9 pKa = 5.2FIALISPEE17 pKa = 3.74IEE19 pKa = 3.94EE20 pKa = 4.61EE21 pKa = 4.24VEE23 pKa = 4.03QQINLAAEE31 pKa = 4.07RR32 pKa = 11.84QNPVISWDD40 pKa = 3.48EE41 pKa = 3.67FAGYY45 pKa = 10.62YY46 pKa = 9.62SS47 pKa = 3.45
MM1 pKa = 7.26LHH3 pKa = 7.23DD4 pKa = 4.7FDD6 pKa = 6.33DD7 pKa = 4.44EE8 pKa = 4.22EE9 pKa = 5.2FIALISPEE17 pKa = 3.74IEE19 pKa = 3.94EE20 pKa = 4.61EE21 pKa = 4.24VEE23 pKa = 4.03QQINLAAEE31 pKa = 4.07RR32 pKa = 11.84QNPVISWDD40 pKa = 3.48EE41 pKa = 3.67FAGYY45 pKa = 10.62YY46 pKa = 9.62SS47 pKa = 3.45
Molecular weight: 5.53 kDa
Isoelectric point according different methods:
Protein with the highest isoelectric point:
>tr|A0A5C0CAT4|A0A5C0CAT4_9CAUD Nin protein OS=Salmonella phage SI8 OX=2592213 PE=4 SV=1
MM1 pKa = 7.54RR2 pKa = 11.84RR3 pKa = 11.84QRR5 pKa = 11.84RR6 pKa = 11.84SITDD10 pKa = 4.1IICEE14 pKa = 3.96NCKK17 pKa = 10.21YY18 pKa = 10.77LPTKK22 pKa = 10.48RR23 pKa = 11.84SRR25 pKa = 11.84NKK27 pKa = 9.87PKK29 pKa = 9.99PAPNEE34 pKa = 4.01SDD36 pKa = 3.45VKK38 pKa = 9.34TFNYY42 pKa = 7.51TAHH45 pKa = 6.73LWDD48 pKa = 4.0IRR50 pKa = 11.84WLRR53 pKa = 11.84YY54 pKa = 8.87RR55 pKa = 11.84ARR57 pKa = 11.84KK58 pKa = 8.72
MM1 pKa = 7.54RR2 pKa = 11.84RR3 pKa = 11.84QRR5 pKa = 11.84RR6 pKa = 11.84SITDD10 pKa = 4.1IICEE14 pKa = 3.96NCKK17 pKa = 10.21YY18 pKa = 10.77LPTKK22 pKa = 10.48RR23 pKa = 11.84SRR25 pKa = 11.84NKK27 pKa = 9.87PKK29 pKa = 9.99PAPNEE34 pKa = 4.01SDD36 pKa = 3.45VKK38 pKa = 9.34TFNYY42 pKa = 7.51TAHH45 pKa = 6.73LWDD48 pKa = 4.0IRR50 pKa = 11.84WLRR53 pKa = 11.84YY54 pKa = 8.87RR55 pKa = 11.84ARR57 pKa = 11.84KK58 pKa = 8.72
Molecular weight: 7.18 kDa
Isoelectric point according different methods:
Peptides (in silico digests for buttom-up proteomics)
Below you can find in silico digests of the whole proteome with Trypsin, Chymotrypsin, Trypsin+LysC, LysN, ArgC proteases suitable for different mass spec machines.| Try ESI |
 |
|---|
| ChTry ESI |
|
|---|
| ArgC ESI |
|
|---|
| LysN ESI |
|
|---|
| TryLysC ESI |
|
|---|
| Try MALDI |
|
|---|
| ChTry MALDI |
|
|---|
| ArgC MALDI |
|
|---|
| LysN MALDI |
|
|---|
| TryLysC MALDI |
|
|---|
| Try LTQ |
|
|---|
| ChTry LTQ |
|
|---|
| ArgC LTQ |
|
|---|
| LysN LTQ |
|
|---|
| TryLysC LTQ |
|
|---|
| Try MSlow |
|
|---|
| ChTry MSlow |
|
|---|
| ArgC MSlow |
|
|---|
| LysN MSlow |
|
|---|
| TryLysC MSlow |
|
|---|
| Try MShigh |
|
|---|
| ChTry MShigh |
|
|---|
| ArgC MShigh |
|
|---|
| LysN MShigh |
|
|---|
| TryLysC MShigh |
|
|---|
General Statistics
Number of major isoforms |
Number of additional isoforms |
Number of all proteins |
Number of amino acids |
Min. Seq. Length |
Max. Seq. Length |
Avg. Seq. Length |
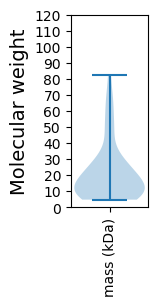
Avg. Mol. Weight |
|---|---|---|---|---|---|---|---|
0 |
11955 |
41 |
725 |
189.8 |
21.31 |
Amino acid frequency
Ala |
Cys |
Asp |
Glu |
Phe |
Gly |
His |
Ile |
Lys |
Leu |
|---|---|---|---|---|---|---|---|---|---|
9.076 ± 0.533 | 1.154 ± 0.149 |
5.931 ± 0.264 | 6.893 ± 0.369 |
3.739 ± 0.299 | 7.143 ± 0.379 |
1.782 ± 0.176 | 6.257 ± 0.422 |
6.19 ± 0.245 | 7.553 ± 0.312 |
Met |
Asn |
Gln |
Pro |
Arg |
Ser |
Thr |
Val |
Trp |
Tyr |
|---|---|---|---|---|---|---|---|---|---|
2.535 ± 0.134 | 4.86 ± 0.308 |
3.756 ± 0.186 | 4.835 ± 0.393 |
6.023 ± 0.265 | 6.19 ± 0.271 |
5.178 ± 0.298 | 5.688 ± 0.291 |
1.606 ± 0.15 | 3.614 ± 0.209 |
Most of the basic statistics you can see at this page can be downloaded from this CSV file
See this proteome in:

Proteome-pI is available under Creative Commons Attribution-NoDerivs license, for more details see here
| Reference: Kozlowski LP. Proteome-pI 2.0: Proteome Isoelectric Point Database Update. Nucleic Acids Res. 2021, doi: 10.1093/nar/gkab944 | Contact: Lukasz P. Kozlowski |