Tetterwort vein chlorosis virus
Taxonomy: Viruses; Riboviria; Orthornavirae; Kitrinoviricota; Alsuviricetes; Martellivirales; Closteroviridae; Crinivirus
Average proteome isoelectric point is 6.56
Get precalculated fractions of proteins
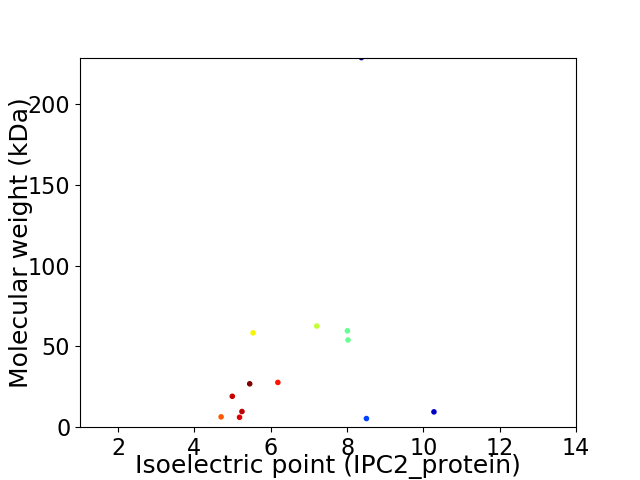
Virtual 2D-PAGE plot for 13 proteins (isoelectric point calculated using IPC2_protein)
Get csv file with sequences according to given criteria:
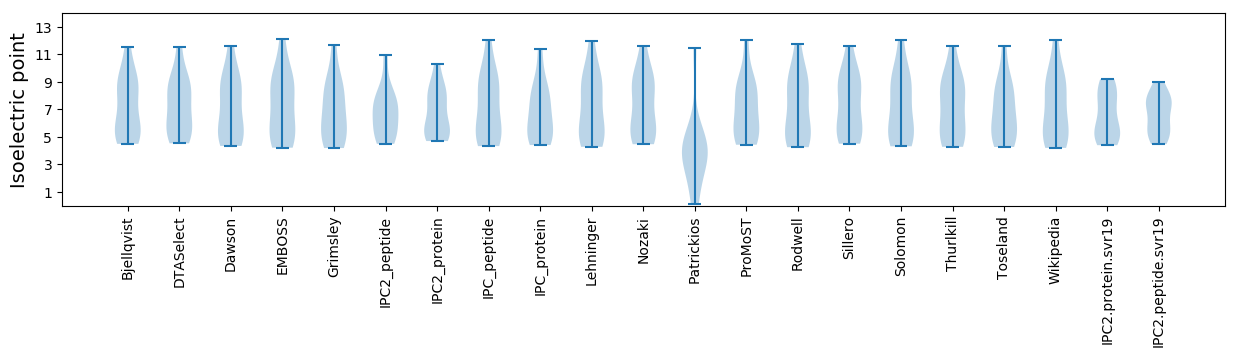
* You can choose from 21 different methods for calculating isoelectric point
Summary statistics related to proteome-wise predictions
Protein with the lowest isoelectric point:
>tr|A0A0M4MYI6|A0A0M4MYI6_9CLOS Leader protease OS=Tetterwort vein chlorosis virus OX=1712389 PE=4 SV=1
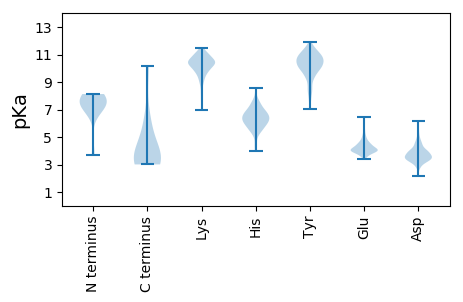
MM1 pKa = 7.32GLIIVVYY8 pKa = 10.35KK9 pKa = 8.3FYY11 pKa = 11.1CGVNIYY17 pKa = 10.27YY18 pKa = 10.49CSNNRR23 pKa = 11.84DD24 pKa = 3.28FVGDD28 pKa = 3.72FEE30 pKa = 5.42VVTTTEE36 pKa = 4.01LEE38 pKa = 4.0KK39 pKa = 10.76LVEE42 pKa = 4.18IFEE45 pKa = 4.53SFPFVRR51 pKa = 11.84TTWW54 pKa = 3.01
MM1 pKa = 7.32GLIIVVYY8 pKa = 10.35KK9 pKa = 8.3FYY11 pKa = 11.1CGVNIYY17 pKa = 10.27YY18 pKa = 10.49CSNNRR23 pKa = 11.84DD24 pKa = 3.28FVGDD28 pKa = 3.72FEE30 pKa = 5.42VVTTTEE36 pKa = 4.01LEE38 pKa = 4.0KK39 pKa = 10.76LVEE42 pKa = 4.18IFEE45 pKa = 4.53SFPFVRR51 pKa = 11.84TTWW54 pKa = 3.01
Molecular weight: 6.4 kDa
Isoelectric point according different methods:
Protein with the highest isoelectric point:
>tr|A0A0M4LY14|A0A0M4LY14_9CLOS 59.7-kDa protein OS=Tetterwort vein chlorosis virus OX=1712389 PE=4 SV=1
MM1 pKa = 6.83LTMYY5 pKa = 7.66RR6 pKa = 11.84THH8 pKa = 6.96VIHH11 pKa = 6.98LFPHH15 pKa = 5.26GRR17 pKa = 11.84IWFHH21 pKa = 6.51EE22 pKa = 4.03KK23 pKa = 10.45SIPKK27 pKa = 9.68QKK29 pKa = 10.24QNKK32 pKa = 7.47KK33 pKa = 9.96QKK35 pKa = 9.28TKK37 pKa = 9.47TKK39 pKa = 9.88QNISRR44 pKa = 11.84RR45 pKa = 11.84LYY47 pKa = 10.65LKK49 pKa = 10.42LNKK52 pKa = 8.84FTVVFAHH59 pKa = 6.27TFRR62 pKa = 11.84ARR64 pKa = 11.84CLCAMFRR71 pKa = 11.84HH72 pKa = 6.12VSRR75 pKa = 11.84EE76 pKa = 3.64RR77 pKa = 3.27
MM1 pKa = 6.83LTMYY5 pKa = 7.66RR6 pKa = 11.84THH8 pKa = 6.96VIHH11 pKa = 6.98LFPHH15 pKa = 5.26GRR17 pKa = 11.84IWFHH21 pKa = 6.51EE22 pKa = 4.03KK23 pKa = 10.45SIPKK27 pKa = 9.68QKK29 pKa = 10.24QNKK32 pKa = 7.47KK33 pKa = 9.96QKK35 pKa = 9.28TKK37 pKa = 9.47TKK39 pKa = 9.88QNISRR44 pKa = 11.84RR45 pKa = 11.84LYY47 pKa = 10.65LKK49 pKa = 10.42LNKK52 pKa = 8.84FTVVFAHH59 pKa = 6.27TFRR62 pKa = 11.84ARR64 pKa = 11.84CLCAMFRR71 pKa = 11.84HH72 pKa = 6.12VSRR75 pKa = 11.84EE76 pKa = 3.64RR77 pKa = 3.27
Molecular weight: 9.5 kDa
Isoelectric point according different methods:
Peptides (in silico digests for buttom-up proteomics)
Below you can find in silico digests of the whole proteome with Trypsin, Chymotrypsin, Trypsin+LysC, LysN, ArgC proteases suitable for different mass spec machines.| Try ESI |
 |
|---|
| ChTry ESI |
|
|---|
| ArgC ESI |
|
|---|
| LysN ESI |
|
|---|
| TryLysC ESI |
|
|---|
| Try MALDI |
|
|---|
| ChTry MALDI |
|
|---|
| ArgC MALDI |
|
|---|
| LysN MALDI |
|
|---|
| TryLysC MALDI |
|
|---|
| Try LTQ |
|
|---|
| ChTry LTQ |
|
|---|
| ArgC LTQ |
|
|---|
| LysN LTQ |
|
|---|
| TryLysC LTQ |
|
|---|
| Try MSlow |
|
|---|
| ChTry MSlow |
|
|---|
| ArgC MSlow |
|
|---|
| LysN MSlow |
|
|---|
| TryLysC MSlow |
|
|---|
| Try MShigh |
|
|---|
| ChTry MShigh |
|
|---|
| ArgC MShigh |
|
|---|
| LysN MShigh |
|
|---|
| TryLysC MShigh |
|
|---|
General Statistics
Number of major isoforms |
Number of additional isoforms |
Number of all proteins |
Number of amino acids |
Min. Seq. Length |
Max. Seq. Length |
Avg. Seq. Length |
Avg. Mol. Weight |
|---|---|---|---|---|---|---|---|
0 |
4987 |
44 |
1992 |
383.6 |
44.21 |
Amino acid frequency
Ala |
Cys |
Asp |
Glu |
Phe |
Gly |
His |
Ile |
Lys |
Leu |
|---|---|---|---|---|---|---|---|---|---|
3.91 ± 0.459 | 2.206 ± 0.285 |
6.517 ± 0.351 | 5.153 ± 0.272 |
5.875 ± 0.53 | 4.833 ± 0.246 |
2.065 ± 0.245 | 6.818 ± 0.372 |
7.7 ± 0.292 | 9.505 ± 0.642 |
Met |
Asn |
Gln |
Pro |
Arg |
Ser |
Thr |
Val |
Trp |
Tyr |
|---|---|---|---|---|---|---|---|---|---|
2.847 ± 0.256 | 6.357 ± 0.683 |
3.128 ± 0.271 | 2.727 ± 0.247 |
5.354 ± 0.579 | 7.419 ± 0.396 |
5.474 ± 0.442 | 6.918 ± 0.384 |
0.862 ± 0.153 | 4.331 ± 0.421 |
Most of the basic statistics you can see at this page can be downloaded from this CSV file
See this proteome in:

Proteome-pI is available under Creative Commons Attribution-NoDerivs license, for more details see here
| Reference: Kozlowski LP. Proteome-pI 2.0: Proteome Isoelectric Point Database Update. Nucleic Acids Res. 2021, doi: 10.1093/nar/gkab944 | Contact: Lukasz P. Kozlowski |