Methanothermobacter tenebrarum
Taxonomy: cellular organisms; Archaea; Euryarchaeota; Methanomada group; Methanobacteria; Methanobacteriales; Methanobacteriaceae; Methanothermobacter
Average proteome isoelectric point is 6.86
Get precalculated fractions of proteins
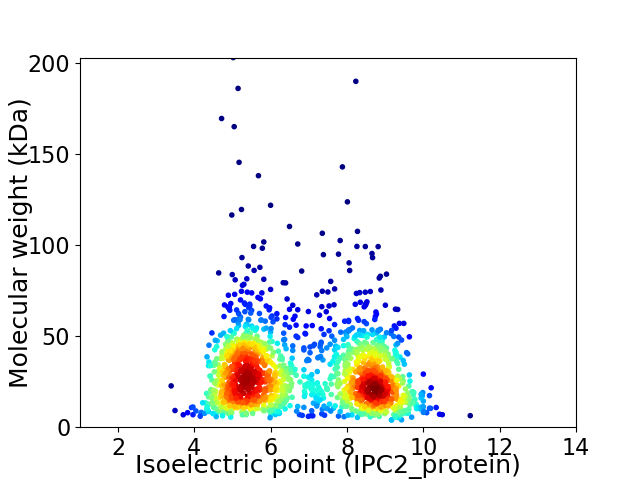
Virtual 2D-PAGE plot for 1556 proteins (isoelectric point calculated using IPC2_protein)
Get csv file with sequences according to given criteria:
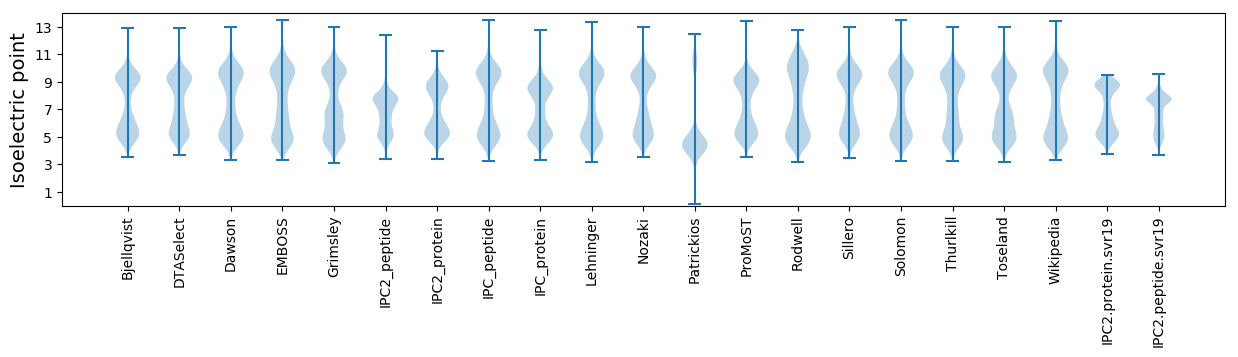
* You can choose from 21 different methods for calculating isoelectric point
Summary statistics related to proteome-wise predictions
Protein with the lowest isoelectric point:
>tr|A0A328PJB3|A0A328PJB3_9EURY Glutamyl-tRNA(Gln) amidotransferase subunit D OS=Methanothermobacter tenebrarum OX=680118 GN=gatD PE=3 SV=1
MM1 pKa = 8.21DD2 pKa = 5.03MLPLIKK8 pKa = 10.21VVPEE12 pKa = 3.96FNYY15 pKa = 10.94SLDD18 pKa = 3.52PSTGVIGAAVGRR30 pKa = 11.84EE31 pKa = 3.89LLILSMDD38 pKa = 4.82EE39 pKa = 3.9INEE42 pKa = 3.96QIAALEE48 pKa = 4.02ATADD52 pKa = 3.92DD53 pKa = 4.95LVNSLDD59 pKa = 3.77PSTVPEE65 pKa = 4.0GSYY68 pKa = 10.11PGRR71 pKa = 11.84EE72 pKa = 4.1GVYY75 pKa = 9.01LTAGKK80 pKa = 8.42LTNIVYY86 pKa = 9.91GFILGMILLCALIFLL101 pKa = 4.97
MM1 pKa = 8.21DD2 pKa = 5.03MLPLIKK8 pKa = 10.21VVPEE12 pKa = 3.96FNYY15 pKa = 10.94SLDD18 pKa = 3.52PSTGVIGAAVGRR30 pKa = 11.84EE31 pKa = 3.89LLILSMDD38 pKa = 4.82EE39 pKa = 3.9INEE42 pKa = 3.96QIAALEE48 pKa = 4.02ATADD52 pKa = 3.92DD53 pKa = 4.95LVNSLDD59 pKa = 3.77PSTVPEE65 pKa = 4.0GSYY68 pKa = 10.11PGRR71 pKa = 11.84EE72 pKa = 4.1GVYY75 pKa = 9.01LTAGKK80 pKa = 8.42LTNIVYY86 pKa = 9.91GFILGMILLCALIFLL101 pKa = 4.97
Molecular weight: 10.8 kDa
Isoelectric point according different methods:
Protein with the highest isoelectric point:
>tr|A0A328P9J5|A0A328P9J5_9EURY Transcriptional regulator OS=Methanothermobacter tenebrarum OX=680118 GN=DPC56_02750 PE=4 SV=1
MM1 pKa = 7.39SRR3 pKa = 11.84NKK5 pKa = 10.06HH6 pKa = 3.93VAKK9 pKa = 10.56KK10 pKa = 10.06IRR12 pKa = 11.84LSKK15 pKa = 10.46ARR17 pKa = 11.84KK18 pKa = 6.67QNRR21 pKa = 11.84RR22 pKa = 11.84VPVWVLLKK30 pKa = 9.6TNRR33 pKa = 11.84RR34 pKa = 11.84VLTHH38 pKa = 6.09PKK40 pKa = 7.61MRR42 pKa = 11.84HH43 pKa = 3.38WRR45 pKa = 11.84RR46 pKa = 11.84TKK48 pKa = 10.85LKK50 pKa = 10.03VV51 pKa = 2.95
MM1 pKa = 7.39SRR3 pKa = 11.84NKK5 pKa = 10.06HH6 pKa = 3.93VAKK9 pKa = 10.56KK10 pKa = 10.06IRR12 pKa = 11.84LSKK15 pKa = 10.46ARR17 pKa = 11.84KK18 pKa = 6.67QNRR21 pKa = 11.84RR22 pKa = 11.84VPVWVLLKK30 pKa = 9.6TNRR33 pKa = 11.84RR34 pKa = 11.84VLTHH38 pKa = 6.09PKK40 pKa = 7.61MRR42 pKa = 11.84HH43 pKa = 3.38WRR45 pKa = 11.84RR46 pKa = 11.84TKK48 pKa = 10.85LKK50 pKa = 10.03VV51 pKa = 2.95
Molecular weight: 6.34 kDa
Isoelectric point according different methods:
Peptides (in silico digests for buttom-up proteomics)
Below you can find in silico digests of the whole proteome with Trypsin, Chymotrypsin, Trypsin+LysC, LysN, ArgC proteases suitable for different mass spec machines.| Try ESI |
 |
|---|
| ChTry ESI |
|
|---|
| ArgC ESI |
|
|---|
| LysN ESI |
|
|---|
| TryLysC ESI |
|
|---|
| Try MALDI |
|
|---|
| ChTry MALDI |
|
|---|
| ArgC MALDI |
|
|---|
| LysN MALDI |
|
|---|
| TryLysC MALDI |
|
|---|
| Try LTQ |
|
|---|
| ChTry LTQ |
|
|---|
| ArgC LTQ |
|
|---|
| LysN LTQ |
|
|---|
| TryLysC LTQ |
|
|---|
| Try MSlow |
|
|---|
| ChTry MSlow |
|
|---|
| ArgC MSlow |
|
|---|
| LysN MSlow |
|
|---|
| TryLysC MSlow |
|
|---|
| Try MShigh |
|
|---|
| ChTry MShigh |
|
|---|
| ArgC MShigh |
|
|---|
| LysN MShigh |
|
|---|
| TryLysC MShigh |
|
|---|
General Statistics
Number of major isoforms |
Number of additional isoforms |
Number of all proteins |
Number of amino acids |
Min. Seq. Length |
Max. Seq. Length |
Avg. Seq. Length |
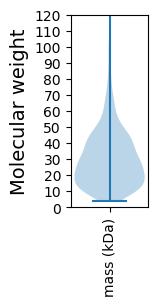
Avg. Mol. Weight |
|---|---|---|---|---|---|---|---|
0 |
437150 |
37 |
1840 |
280.9 |
31.57 |
Amino acid frequency
Ala |
Cys |
Asp |
Glu |
Phe |
Gly |
His |
Ile |
Lys |
Leu |
|---|---|---|---|---|---|---|---|---|---|
6.576 ± 0.056 | 1.157 ± 0.035 |
5.283 ± 0.039 | 7.985 ± 0.072 |
3.814 ± 0.051 | 7.101 ± 0.054 |
1.827 ± 0.029 | 10.15 ± 0.067 |
8.558 ± 0.085 | 9.366 ± 0.057 |
Met |
Asn |
Gln |
Pro |
Arg |
Ser |
Thr |
Val |
Trp |
Tyr |
|---|---|---|---|---|---|---|---|---|---|
2.53 ± 0.027 | 3.918 ± 0.043 |
4.279 ± 0.035 | 2.067 ± 0.027 |
4.789 ± 0.046 | 5.236 ± 0.041 |
5.003 ± 0.052 | 6.159 ± 0.05 |
0.768 ± 0.024 | 3.431 ± 0.043 |
Most of the basic statistics you can see at this page can be downloaded from this CSV file
See this proteome in:

Proteome-pI is available under Creative Commons Attribution-NoDerivs license, for more details see here
| Reference: Kozlowski LP. Proteome-pI 2.0: Proteome Isoelectric Point Database Update. Nucleic Acids Res. 2021, doi: 10.1093/nar/gkab944 | Contact: Lukasz P. Kozlowski |