Theileria orientalis strain Shintoku
Taxonomy: cellular organisms; Eukaryota; Sar; Alveolata; Apicomplexa; Aconoidasida; Piroplasmida; Theileriidae; Theileria; Theileria orientalis
Average proteome isoelectric point is 6.91
Get precalculated fractions of proteins
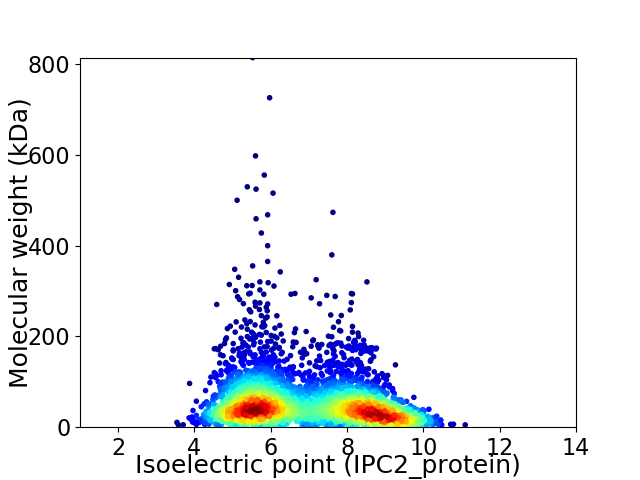
Virtual 2D-PAGE plot for 3989 proteins (isoelectric point calculated using IPC2_protein)
Get csv file with sequences according to given criteria:
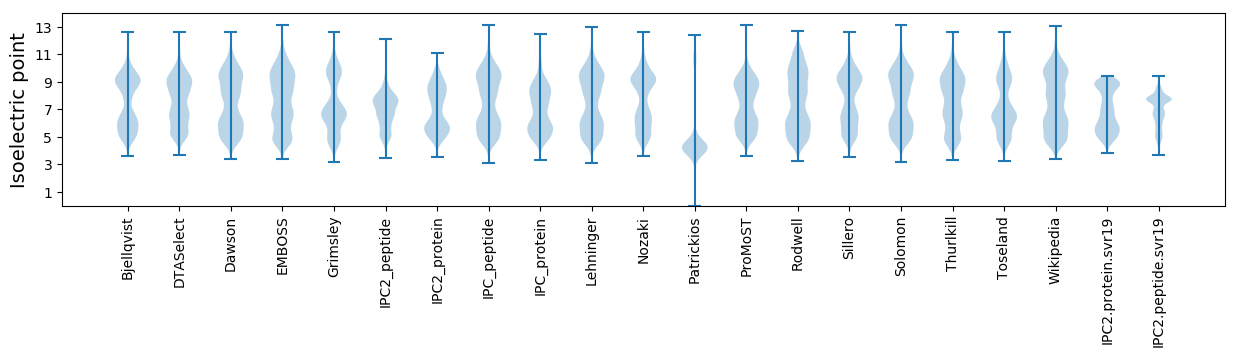
* You can choose from 21 different methods for calculating isoelectric point
Summary statistics related to proteome-wise predictions
Protein with the lowest isoelectric point:
>tr|J4DQ86|J4DQ86_THEOR GPI mannosyltransferase 1 OS=Theileria orientalis strain Shintoku OX=869250 GN=TOT_040000395 PE=3 SV=1
MM1 pKa = 7.36IADD4 pKa = 4.64PGTTFNNLGATPMKK18 pKa = 10.75NPLTPYY24 pKa = 10.84VLFILINSLNMLDD37 pKa = 5.17FLDD40 pKa = 4.17PMMLFLLFCMSTLPAA55 pKa = 5.13
MM1 pKa = 7.36IADD4 pKa = 4.64PGTTFNNLGATPMKK18 pKa = 10.75NPLTPYY24 pKa = 10.84VLFILINSLNMLDD37 pKa = 5.17FLDD40 pKa = 4.17PMMLFLLFCMSTLPAA55 pKa = 5.13
Molecular weight: 6.12 kDa
Isoelectric point according different methods:
Protein with the highest isoelectric point:
>tr|J4CDH2|J4CDH2_THEOR Uncharacterized protein OS=Theileria orientalis strain Shintoku OX=869250 GN=TOT_030000400 PE=4 SV=1
MM1 pKa = 7.13SHH3 pKa = 6.36GASRR7 pKa = 11.84YY8 pKa = 9.02KK9 pKa = 10.21KK10 pKa = 9.89AHH12 pKa = 6.23AKK14 pKa = 8.78MRR16 pKa = 11.84WKK18 pKa = 9.17WKK20 pKa = 9.51KK21 pKa = 10.24KK22 pKa = 7.88RR23 pKa = 11.84THH25 pKa = 5.93RR26 pKa = 11.84LQRR29 pKa = 11.84KK30 pKa = 6.33RR31 pKa = 11.84RR32 pKa = 11.84KK33 pKa = 8.28MRR35 pKa = 11.84QRR37 pKa = 11.84SRR39 pKa = 3.22
MM1 pKa = 7.13SHH3 pKa = 6.36GASRR7 pKa = 11.84YY8 pKa = 9.02KK9 pKa = 10.21KK10 pKa = 9.89AHH12 pKa = 6.23AKK14 pKa = 8.78MRR16 pKa = 11.84WKK18 pKa = 9.17WKK20 pKa = 9.51KK21 pKa = 10.24KK22 pKa = 7.88RR23 pKa = 11.84THH25 pKa = 5.93RR26 pKa = 11.84LQRR29 pKa = 11.84KK30 pKa = 6.33RR31 pKa = 11.84RR32 pKa = 11.84KK33 pKa = 8.28MRR35 pKa = 11.84QRR37 pKa = 11.84SRR39 pKa = 3.22
Molecular weight: 5.08 kDa
Isoelectric point according different methods:
Peptides (in silico digests for buttom-up proteomics)
Below you can find in silico digests of the whole proteome with Trypsin, Chymotrypsin, Trypsin+LysC, LysN, ArgC proteases suitable for different mass spec machines.| Try ESI |
 |
|---|
| ChTry ESI |
|
|---|
| ArgC ESI |
|
|---|
| LysN ESI |
|
|---|
| TryLysC ESI |
|
|---|
| Try MALDI |
|
|---|
| ChTry MALDI |
|
|---|
| ArgC MALDI |
|
|---|
| LysN MALDI |
|
|---|
| TryLysC MALDI |
|
|---|
| Try LTQ |
|
|---|
| ChTry LTQ |
|
|---|
| ArgC LTQ |
|
|---|
| LysN LTQ |
|
|---|
| TryLysC LTQ |
|
|---|
| Try MSlow |
|
|---|
| ChTry MSlow |
|
|---|
| ArgC MSlow |
|
|---|
| LysN MSlow |
|
|---|
| TryLysC MSlow |
|
|---|
| Try MShigh |
|
|---|
| ChTry MShigh |
|
|---|
| ArgC MShigh |
|
|---|
| LysN MShigh |
|
|---|
| TryLysC MShigh |
|
|---|
General Statistics
Number of major isoforms |
Number of additional isoforms |
Number of all proteins |
Number of amino acids |
Min. Seq. Length |
Max. Seq. Length |
Avg. Seq. Length |
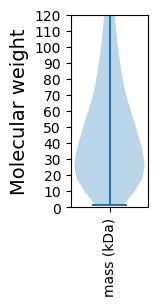
Avg. Mol. Weight |
|---|---|---|---|---|---|---|---|
0 |
2048270 |
12 |
7144 |
513.5 |
58.44 |
Amino acid frequency
Ala |
Cys |
Asp |
Glu |
Phe |
Gly |
His |
Ile |
Lys |
Leu |
|---|---|---|---|---|---|---|---|---|---|
4.785 ± 0.036 | 1.657 ± 0.021 |
5.713 ± 0.023 | 6.869 ± 0.045 |
4.47 ± 0.031 | 5.147 ± 0.037 |
2.211 ± 0.015 | 5.737 ± 0.045 |
7.713 ± 0.035 | 9.641 ± 0.053 |
Met |
Asn |
Gln |
Pro |
Arg |
Ser |
Thr |
Val |
Trp |
Tyr |
|---|---|---|---|---|---|---|---|---|---|
2.283 ± 0.021 | 6.255 ± 0.031 |
3.763 ± 0.041 | 3.076 ± 0.026 |
4.813 ± 0.03 | 8.702 ± 0.044 |
5.59 ± 0.035 | 6.509 ± 0.034 |
0.823 ± 0.009 | 4.244 ± 0.025 |
Most of the basic statistics you can see at this page can be downloaded from this CSV file
See this proteome in:

Proteome-pI is available under Creative Commons Attribution-NoDerivs license, for more details see here
| Reference: Kozlowski LP. Proteome-pI 2.0: Proteome Isoelectric Point Database Update. Nucleic Acids Res. 2021, doi: 10.1093/nar/gkab944 | Contact: Lukasz P. Kozlowski |