Thioflexothrix psekupsii
Taxonomy: cellular organisms; Bacteria; Proteobacteria; Gammaproteobacteria; Thiotrichales; Thiotrichales incertae sedis; Thioflexothrix
Average proteome isoelectric point is 6.2
Get precalculated fractions of proteins
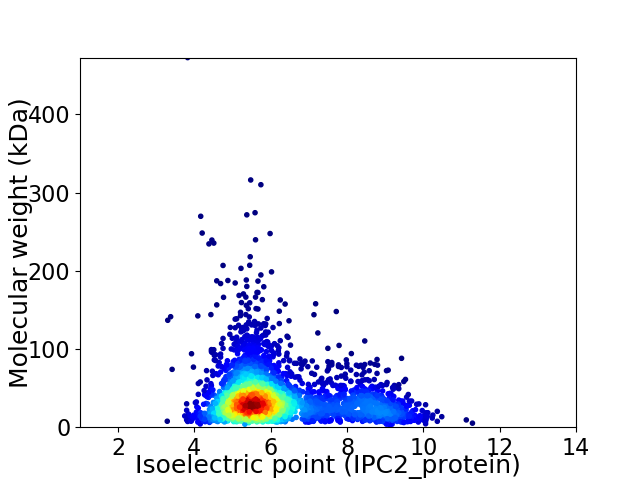
Virtual 2D-PAGE plot for 3187 proteins (isoelectric point calculated using IPC2_protein)
Get csv file with sequences according to given criteria:
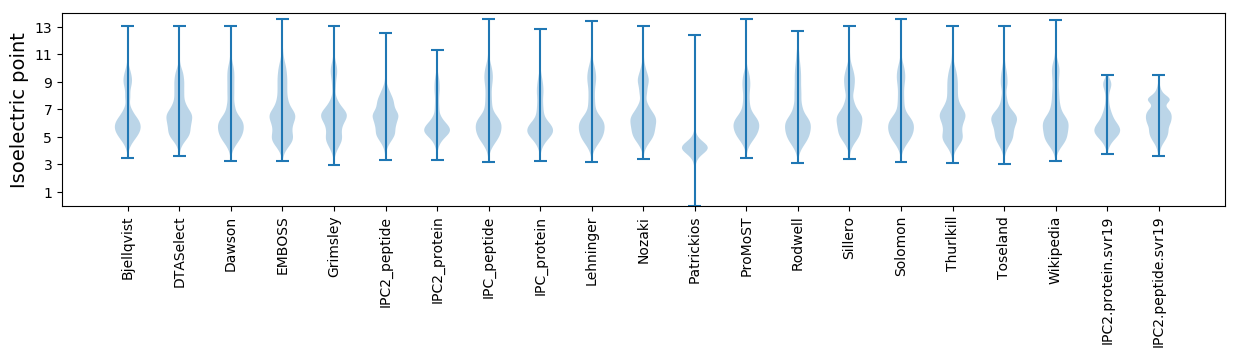
* You can choose from 21 different methods for calculating isoelectric point
Summary statistics related to proteome-wise predictions
Protein with the lowest isoelectric point:
>tr|A0A251XA25|A0A251XA25_9GAMM Uncharacterized protein OS=Thioflexothrix psekupsii OX=1570016 GN=TPSD3_09580 PE=4 SV=1
MM1 pKa = 7.52SLQNSLDD8 pKa = 3.38GLTEE12 pKa = 3.63EE13 pKa = 4.03LRR15 pKa = 11.84RR16 pKa = 11.84RR17 pKa = 11.84RR18 pKa = 11.84RR19 pKa = 11.84EE20 pKa = 3.79AQEE23 pKa = 5.27SIDD26 pKa = 4.06SCCDD30 pKa = 3.13TSDD33 pKa = 4.56DD34 pKa = 3.52LHH36 pKa = 7.72GFYY39 pKa = 10.82GVDD42 pKa = 3.2SDD44 pKa = 6.35DD45 pKa = 3.39IVSYY49 pKa = 11.04DD50 pKa = 3.98FNHH53 pKa = 7.06HH54 pKa = 7.11ANDD57 pKa = 3.74QYY59 pKa = 11.5EE60 pKa = 4.52PPHH63 pKa = 8.16SDD65 pKa = 3.71DD66 pKa = 3.79FCDD69 pKa = 5.28DD70 pKa = 3.48VSSDD74 pKa = 3.21
MM1 pKa = 7.52SLQNSLDD8 pKa = 3.38GLTEE12 pKa = 3.63EE13 pKa = 4.03LRR15 pKa = 11.84RR16 pKa = 11.84RR17 pKa = 11.84RR18 pKa = 11.84RR19 pKa = 11.84EE20 pKa = 3.79AQEE23 pKa = 5.27SIDD26 pKa = 4.06SCCDD30 pKa = 3.13TSDD33 pKa = 4.56DD34 pKa = 3.52LHH36 pKa = 7.72GFYY39 pKa = 10.82GVDD42 pKa = 3.2SDD44 pKa = 6.35DD45 pKa = 3.39IVSYY49 pKa = 11.04DD50 pKa = 3.98FNHH53 pKa = 7.06HH54 pKa = 7.11ANDD57 pKa = 3.74QYY59 pKa = 11.5EE60 pKa = 4.52PPHH63 pKa = 8.16SDD65 pKa = 3.71DD66 pKa = 3.79FCDD69 pKa = 5.28DD70 pKa = 3.48VSSDD74 pKa = 3.21
Molecular weight: 8.49 kDa
Isoelectric point according different methods:
Protein with the highest isoelectric point:
>tr|A0A251X694|A0A251X694_9GAMM Uncharacterized protein OS=Thioflexothrix psekupsii OX=1570016 GN=TPSD3_10880 PE=4 SV=1
MM1 pKa = 7.45KK2 pKa = 9.61RR3 pKa = 11.84TFQPSNLVRR12 pKa = 11.84KK13 pKa = 9.18RR14 pKa = 11.84RR15 pKa = 11.84HH16 pKa = 4.5GFRR19 pKa = 11.84ARR21 pKa = 11.84MKK23 pKa = 9.02TRR25 pKa = 11.84GGRR28 pKa = 11.84AVIQARR34 pKa = 11.84RR35 pKa = 11.84AKK37 pKa = 10.51GRR39 pKa = 11.84VRR41 pKa = 11.84LSAA44 pKa = 3.96
MM1 pKa = 7.45KK2 pKa = 9.61RR3 pKa = 11.84TFQPSNLVRR12 pKa = 11.84KK13 pKa = 9.18RR14 pKa = 11.84RR15 pKa = 11.84HH16 pKa = 4.5GFRR19 pKa = 11.84ARR21 pKa = 11.84MKK23 pKa = 9.02TRR25 pKa = 11.84GGRR28 pKa = 11.84AVIQARR34 pKa = 11.84RR35 pKa = 11.84AKK37 pKa = 10.51GRR39 pKa = 11.84VRR41 pKa = 11.84LSAA44 pKa = 3.96
Molecular weight: 5.16 kDa
Isoelectric point according different methods:
Peptides (in silico digests for buttom-up proteomics)
Below you can find in silico digests of the whole proteome with Trypsin, Chymotrypsin, Trypsin+LysC, LysN, ArgC proteases suitable for different mass spec machines.| Try ESI |
 |
|---|
| ChTry ESI |
|
|---|
| ArgC ESI |
|
|---|
| LysN ESI |
|
|---|
| TryLysC ESI |
|
|---|
| Try MALDI |
|
|---|
| ChTry MALDI |
|
|---|
| ArgC MALDI |
|
|---|
| LysN MALDI |
|
|---|
| TryLysC MALDI |
|
|---|
| Try LTQ |
|
|---|
| ChTry LTQ |
|
|---|
| ArgC LTQ |
|
|---|
| LysN LTQ |
|
|---|
| TryLysC LTQ |
|
|---|
| Try MSlow |
|
|---|
| ChTry MSlow |
|
|---|
| ArgC MSlow |
|
|---|
| LysN MSlow |
|
|---|
| TryLysC MSlow |
|
|---|
| Try MShigh |
|
|---|
| ChTry MShigh |
|
|---|
| ArgC MShigh |
|
|---|
| LysN MShigh |
|
|---|
| TryLysC MShigh |
|
|---|
General Statistics
Number of major isoforms |
Number of additional isoforms |
Number of all proteins |
Number of amino acids |
Min. Seq. Length |
Max. Seq. Length |
Avg. Seq. Length |
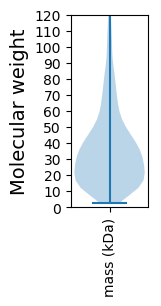
Avg. Mol. Weight |
|---|---|---|---|---|---|---|---|
0 |
1126285 |
21 |
4445 |
353.4 |
39.68 |
Amino acid frequency
Ala |
Cys |
Asp |
Glu |
Phe |
Gly |
His |
Ile |
Lys |
Leu |
|---|---|---|---|---|---|---|---|---|---|
8.509 ± 0.052 | 1.018 ± 0.015 |
5.16 ± 0.04 | 6.296 ± 0.048 |
4.116 ± 0.031 | 6.166 ± 0.053 |
2.68 ± 0.027 | 6.294 ± 0.037 |
4.414 ± 0.042 | 11.541 ± 0.061 |
Met |
Asn |
Gln |
Pro |
Arg |
Ser |
Thr |
Val |
Trp |
Tyr |
|---|---|---|---|---|---|---|---|---|---|
2.249 ± 0.019 | 4.045 ± 0.032 |
4.371 ± 0.033 | 5.507 ± 0.043 |
5.355 ± 0.032 | 5.792 ± 0.036 |
5.481 ± 0.047 | 6.445 ± 0.046 |
1.366 ± 0.02 | 3.196 ± 0.023 |
Most of the basic statistics you can see at this page can be downloaded from this CSV file
See this proteome in:

Proteome-pI is available under Creative Commons Attribution-NoDerivs license, for more details see here
| Reference: Kozlowski LP. Proteome-pI 2.0: Proteome Isoelectric Point Database Update. Nucleic Acids Res. 2021, doi: 10.1093/nar/gkab944 | Contact: Lukasz P. Kozlowski |