Streptococcus satellite phage Javan228
Taxonomy: Viruses; unclassified bacterial viruses
Average proteome isoelectric point is 6.5
Get precalculated fractions of proteins
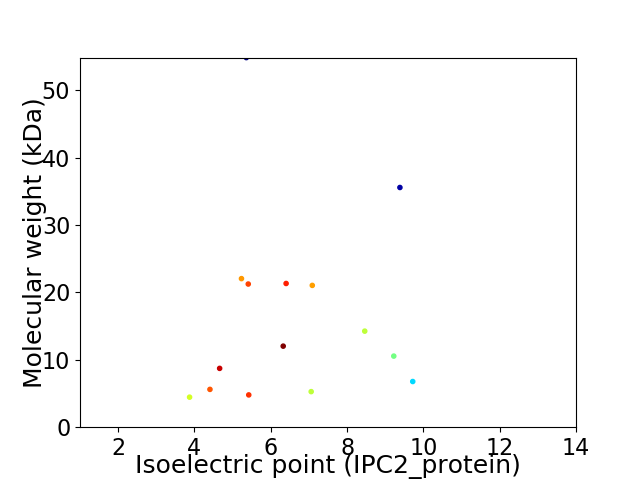
Virtual 2D-PAGE plot for 15 proteins (isoelectric point calculated using IPC2_protein)
Get csv file with sequences according to given criteria:
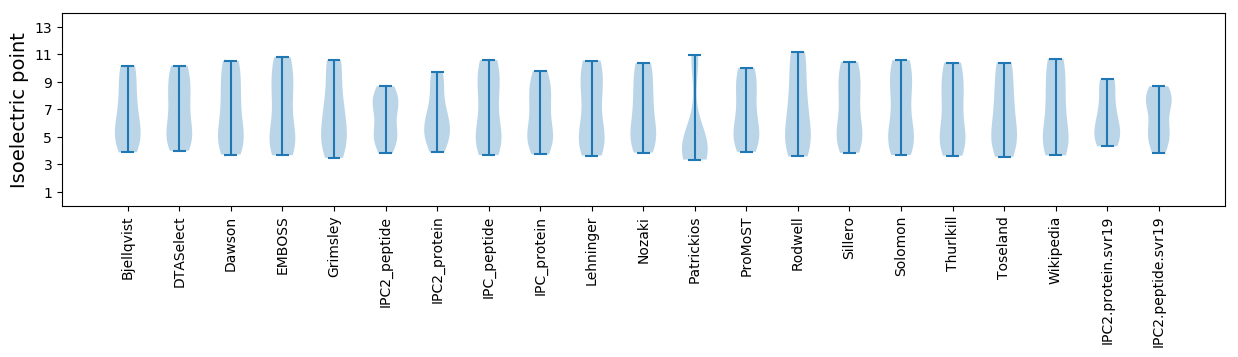
* You can choose from 21 different methods for calculating isoelectric point
Summary statistics related to proteome-wise predictions
Protein with the lowest isoelectric point:
>tr|A0A4D5ZGU8|A0A4D5ZGU8_9VIRU Addiction module toxin OS=Streptococcus satellite phage Javan228 OX=2558581 GN=JavanS228_0015 PE=4 SV=1
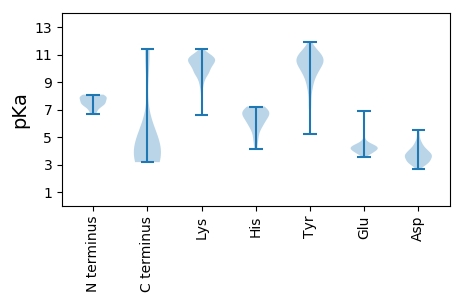
MM1 pKa = 7.9IYY3 pKa = 10.24QEE5 pKa = 4.11INLPIWAQLVLIVVLILVLLLLAYY29 pKa = 9.32IKK31 pKa = 10.34PVEE34 pKa = 4.35DD35 pKa = 3.88VEE37 pKa = 4.38EE38 pKa = 4.52EE39 pKa = 3.79NDD41 pKa = 3.64KK42 pKa = 10.92NHH44 pKa = 7.22PIIMM48 pKa = 4.72
MM1 pKa = 7.9IYY3 pKa = 10.24QEE5 pKa = 4.11INLPIWAQLVLIVVLILVLLLLAYY29 pKa = 9.32IKK31 pKa = 10.34PVEE34 pKa = 4.35DD35 pKa = 3.88VEE37 pKa = 4.38EE38 pKa = 4.52EE39 pKa = 3.79NDD41 pKa = 3.64KK42 pKa = 10.92NHH44 pKa = 7.22PIIMM48 pKa = 4.72
Molecular weight: 5.61 kDa
Isoelectric point according different methods:
Protein with the highest isoelectric point:
>tr|A0A4D5ZLC4|A0A4D5ZLC4_9VIRU Uncharacterized protein OS=Streptococcus satellite phage Javan228 OX=2558581 GN=JavanS228_0013 PE=4 SV=1
MM1 pKa = 7.91IITGIQARR9 pKa = 11.84AVRR12 pKa = 11.84RR13 pKa = 11.84KK14 pKa = 9.48QADD17 pKa = 3.22NMLTAKK23 pKa = 9.41ATAQAIGISPITYY36 pKa = 9.42KK37 pKa = 10.74KK38 pKa = 9.81VVQGGKK44 pKa = 9.68VKK46 pKa = 9.15NTVYY50 pKa = 10.58VKK52 pKa = 10.48VMNWLVEE59 pKa = 4.53DD60 pKa = 4.09YY61 pKa = 11.41
MM1 pKa = 7.91IITGIQARR9 pKa = 11.84AVRR12 pKa = 11.84RR13 pKa = 11.84KK14 pKa = 9.48QADD17 pKa = 3.22NMLTAKK23 pKa = 9.41ATAQAIGISPITYY36 pKa = 9.42KK37 pKa = 10.74KK38 pKa = 9.81VVQGGKK44 pKa = 9.68VKK46 pKa = 9.15NTVYY50 pKa = 10.58VKK52 pKa = 10.48VMNWLVEE59 pKa = 4.53DD60 pKa = 4.09YY61 pKa = 11.41
Molecular weight: 6.78 kDa
Isoelectric point according different methods:
Peptides (in silico digests for buttom-up proteomics)
Below you can find in silico digests of the whole proteome with Trypsin, Chymotrypsin, Trypsin+LysC, LysN, ArgC proteases suitable for different mass spec machines.| Try ESI |
 |
|---|
| ChTry ESI |
|
|---|
| ArgC ESI |
|
|---|
| LysN ESI |
|
|---|
| TryLysC ESI |
|
|---|
| Try MALDI |
|
|---|
| ChTry MALDI |
|
|---|
| ArgC MALDI |
|
|---|
| LysN MALDI |
|
|---|
| TryLysC MALDI |
|
|---|
| Try LTQ |
|
|---|
| ChTry LTQ |
|
|---|
| ArgC LTQ |
|
|---|
| LysN LTQ |
|
|---|
| TryLysC LTQ |
|
|---|
| Try MSlow |
|
|---|
| ChTry MSlow |
|
|---|
| ArgC MSlow |
|
|---|
| LysN MSlow |
|
|---|
| TryLysC MSlow |
|
|---|
| Try MShigh |
|
|---|
| ChTry MShigh |
|
|---|
| ArgC MShigh |
|
|---|
| LysN MShigh |
|
|---|
| TryLysC MShigh |
|
|---|
General Statistics
Number of major isoforms |
Number of additional isoforms |
Number of all proteins |
Number of amino acids |
Min. Seq. Length |
Max. Seq. Length |
Avg. Seq. Length |
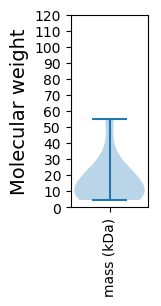
Avg. Mol. Weight |
|---|---|---|---|---|---|---|---|
0 |
2137 |
39 |
467 |
142.5 |
16.58 |
Amino acid frequency
Ala |
Cys |
Asp |
Glu |
Phe |
Gly |
His |
Ile |
Lys |
Leu |
|---|---|---|---|---|---|---|---|---|---|
5.756 ± 0.603 | 0.374 ± 0.153 |
5.662 ± 0.594 | 7.815 ± 0.877 |
4.352 ± 0.723 | 3.884 ± 0.448 |
1.17 ± 0.235 | 7.394 ± 0.602 |
9.499 ± 0.725 | 9.733 ± 0.729 |
Met |
Asn |
Gln |
Pro |
Arg |
Ser |
Thr |
Val |
Trp |
Tyr |
|---|---|---|---|---|---|---|---|---|---|
2.433 ± 0.387 | 6.692 ± 0.445 |
2.153 ± 0.216 | 4.445 ± 0.438 |
4.352 ± 0.415 | 5.054 ± 0.57 |
6.317 ± 0.623 | 6.551 ± 0.712 |
1.217 ± 0.188 | 5.147 ± 0.342 |
Most of the basic statistics you can see at this page can be downloaded from this CSV file
See this proteome in:

Proteome-pI is available under Creative Commons Attribution-NoDerivs license, for more details see here
| Reference: Kozlowski LP. Proteome-pI 2.0: Proteome Isoelectric Point Database Update. Nucleic Acids Res. 2021, doi: 10.1093/nar/gkab944 | Contact: Lukasz P. Kozlowski |