Capybara microvirus Cap3_SP_475
Taxonomy: Viruses; Monodnaviria; Sangervirae; Phixviricota; Malgrandaviricetes; Petitvirales; Microviridae; unclassified Microviridae
Average proteome isoelectric point is 6.87
Get precalculated fractions of proteins
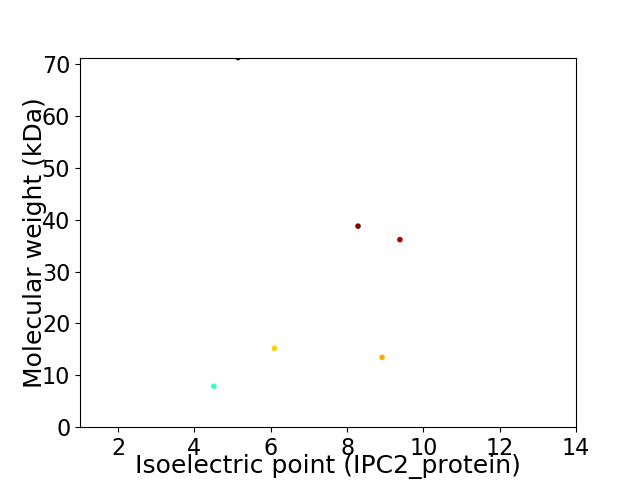
Virtual 2D-PAGE plot for 6 proteins (isoelectric point calculated using IPC2_protein)
Get csv file with sequences according to given criteria:
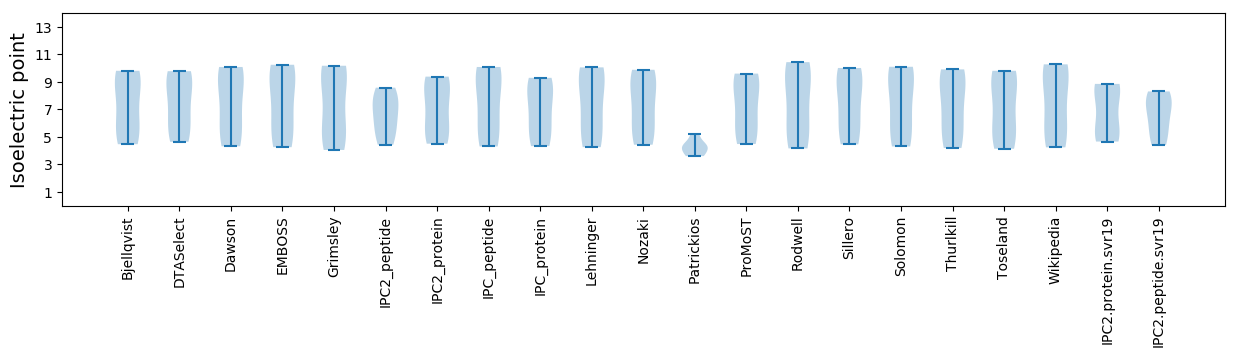
* You can choose from 21 different methods for calculating isoelectric point
Summary statistics related to proteome-wise predictions
Protein with the lowest isoelectric point:
>tr|A0A4V1FVU2|A0A4V1FVU2_9VIRU Minor capsid protein OS=Capybara microvirus Cap3_SP_475 OX=2585467 PE=4 SV=1
MM1 pKa = 7.81LSTLCDD7 pKa = 3.96FNKK10 pKa = 10.03FDD12 pKa = 3.05ISKK15 pKa = 8.32TVRR18 pKa = 11.84IKK20 pKa = 10.55FSNIIITVFEE30 pKa = 4.22SSNFDD35 pKa = 3.45FDD37 pKa = 3.82ITQEE41 pKa = 4.1DD42 pKa = 4.37KK43 pKa = 11.2NLNDD47 pKa = 3.51ISILNDD53 pKa = 3.81SILEE57 pKa = 3.96EE58 pKa = 4.31LNKK61 pKa = 10.65SFTNVKK67 pKa = 10.04LL68 pKa = 3.61
MM1 pKa = 7.81LSTLCDD7 pKa = 3.96FNKK10 pKa = 10.03FDD12 pKa = 3.05ISKK15 pKa = 8.32TVRR18 pKa = 11.84IKK20 pKa = 10.55FSNIIITVFEE30 pKa = 4.22SSNFDD35 pKa = 3.45FDD37 pKa = 3.82ITQEE41 pKa = 4.1DD42 pKa = 4.37KK43 pKa = 11.2NLNDD47 pKa = 3.51ISILNDD53 pKa = 3.81SILEE57 pKa = 3.96EE58 pKa = 4.31LNKK61 pKa = 10.65SFTNVKK67 pKa = 10.04LL68 pKa = 3.61
Molecular weight: 7.88 kDa
Isoelectric point according different methods:
Protein with the highest isoelectric point:
>tr|A0A4P8W503|A0A4P8W503_9VIRU Uncharacterized protein OS=Capybara microvirus Cap3_SP_475 OX=2585467 PE=4 SV=1
MM1 pKa = 7.49KK2 pKa = 10.4CFAPLRR8 pKa = 11.84LKK10 pKa = 10.88VRR12 pKa = 11.84GATNLSGAPVFVPCGRR28 pKa = 11.84CFACKK33 pKa = 9.83QNNRR37 pKa = 11.84NSWSFRR43 pKa = 11.84LHH45 pKa = 6.49NEE47 pKa = 3.56ASSCLNSFFFTLTYY61 pKa = 9.63NPKK64 pKa = 9.46YY65 pKa = 9.66VPKK68 pKa = 10.44IKK70 pKa = 9.97ICNSIFKK77 pKa = 9.08TVSKK81 pKa = 10.7RR82 pKa = 11.84DD83 pKa = 3.25VQLFIKK89 pKa = 10.46RR90 pKa = 11.84LRR92 pKa = 11.84KK93 pKa = 9.71NSGLKK98 pKa = 7.71FTYY101 pKa = 10.39YY102 pKa = 10.04IISEE106 pKa = 4.19YY107 pKa = 10.82GPRR110 pKa = 11.84TNRR113 pKa = 11.84PHH115 pKa = 4.77YY116 pKa = 10.15HH117 pKa = 6.8GIIFLYY123 pKa = 10.81SKK125 pKa = 10.19IDD127 pKa = 3.39KK128 pKa = 10.86DD129 pKa = 3.68NLQKK133 pKa = 10.83FISSSWFLGFCRR145 pKa = 11.84VDD147 pKa = 3.41SLSLARR153 pKa = 11.84IEE155 pKa = 4.44YY156 pKa = 7.69VTAYY160 pKa = 8.77TFKK163 pKa = 10.39EE164 pKa = 3.98CEE166 pKa = 4.0PRR168 pKa = 11.84FKK170 pKa = 10.63KK171 pKa = 10.54YY172 pKa = 9.95QLPNFRR178 pKa = 11.84LTSRR182 pKa = 11.84RR183 pKa = 11.84PALGSSFLEE192 pKa = 4.84DD193 pKa = 3.66YY194 pKa = 11.7NNFDD198 pKa = 4.77LIKK201 pKa = 10.51AIEE204 pKa = 4.29NGLTNIKK211 pKa = 10.84YY212 pKa = 9.64NDD214 pKa = 3.44KK215 pKa = 10.63FINIPRR221 pKa = 11.84YY222 pKa = 8.9YY223 pKa = 9.86KK224 pKa = 10.84NKK226 pKa = 9.79IAPTSNSYY234 pKa = 11.24EE235 pKa = 4.06DD236 pKa = 4.8LEE238 pKa = 4.78NIYY241 pKa = 8.95NTLSFQNDD249 pKa = 3.25YY250 pKa = 11.02NIKK253 pKa = 10.39KK254 pKa = 9.51FYY256 pKa = 10.3KK257 pKa = 9.55YY258 pKa = 11.29YY259 pKa = 10.38KK260 pKa = 9.61IKK262 pKa = 10.26YY263 pKa = 7.79PNWDD267 pKa = 3.12NKK269 pKa = 10.58QILSYY274 pKa = 10.48IFHH277 pKa = 7.01NSNLTHH283 pKa = 5.91NQLRR287 pKa = 11.84FTIKK291 pKa = 10.44QIFKK295 pKa = 10.29NGKK298 pKa = 7.45VQNLYY303 pKa = 10.72DD304 pKa = 3.43
MM1 pKa = 7.49KK2 pKa = 10.4CFAPLRR8 pKa = 11.84LKK10 pKa = 10.88VRR12 pKa = 11.84GATNLSGAPVFVPCGRR28 pKa = 11.84CFACKK33 pKa = 9.83QNNRR37 pKa = 11.84NSWSFRR43 pKa = 11.84LHH45 pKa = 6.49NEE47 pKa = 3.56ASSCLNSFFFTLTYY61 pKa = 9.63NPKK64 pKa = 9.46YY65 pKa = 9.66VPKK68 pKa = 10.44IKK70 pKa = 9.97ICNSIFKK77 pKa = 9.08TVSKK81 pKa = 10.7RR82 pKa = 11.84DD83 pKa = 3.25VQLFIKK89 pKa = 10.46RR90 pKa = 11.84LRR92 pKa = 11.84KK93 pKa = 9.71NSGLKK98 pKa = 7.71FTYY101 pKa = 10.39YY102 pKa = 10.04IISEE106 pKa = 4.19YY107 pKa = 10.82GPRR110 pKa = 11.84TNRR113 pKa = 11.84PHH115 pKa = 4.77YY116 pKa = 10.15HH117 pKa = 6.8GIIFLYY123 pKa = 10.81SKK125 pKa = 10.19IDD127 pKa = 3.39KK128 pKa = 10.86DD129 pKa = 3.68NLQKK133 pKa = 10.83FISSSWFLGFCRR145 pKa = 11.84VDD147 pKa = 3.41SLSLARR153 pKa = 11.84IEE155 pKa = 4.44YY156 pKa = 7.69VTAYY160 pKa = 8.77TFKK163 pKa = 10.39EE164 pKa = 3.98CEE166 pKa = 4.0PRR168 pKa = 11.84FKK170 pKa = 10.63KK171 pKa = 10.54YY172 pKa = 9.95QLPNFRR178 pKa = 11.84LTSRR182 pKa = 11.84RR183 pKa = 11.84PALGSSFLEE192 pKa = 4.84DD193 pKa = 3.66YY194 pKa = 11.7NNFDD198 pKa = 4.77LIKK201 pKa = 10.51AIEE204 pKa = 4.29NGLTNIKK211 pKa = 10.84YY212 pKa = 9.64NDD214 pKa = 3.44KK215 pKa = 10.63FINIPRR221 pKa = 11.84YY222 pKa = 8.9YY223 pKa = 9.86KK224 pKa = 10.84NKK226 pKa = 9.79IAPTSNSYY234 pKa = 11.24EE235 pKa = 4.06DD236 pKa = 4.8LEE238 pKa = 4.78NIYY241 pKa = 8.95NTLSFQNDD249 pKa = 3.25YY250 pKa = 11.02NIKK253 pKa = 10.39KK254 pKa = 9.51FYY256 pKa = 10.3KK257 pKa = 9.55YY258 pKa = 11.29YY259 pKa = 10.38KK260 pKa = 9.61IKK262 pKa = 10.26YY263 pKa = 7.79PNWDD267 pKa = 3.12NKK269 pKa = 10.58QILSYY274 pKa = 10.48IFHH277 pKa = 7.01NSNLTHH283 pKa = 5.91NQLRR287 pKa = 11.84FTIKK291 pKa = 10.44QIFKK295 pKa = 10.29NGKK298 pKa = 7.45VQNLYY303 pKa = 10.72DD304 pKa = 3.43
Molecular weight: 36.15 kDa
Isoelectric point according different methods:
Peptides (in silico digests for buttom-up proteomics)
Below you can find in silico digests of the whole proteome with Trypsin, Chymotrypsin, Trypsin+LysC, LysN, ArgC proteases suitable for different mass spec machines.| Try ESI |
 |
|---|
| ChTry ESI |
|
|---|
| ArgC ESI |
|
|---|
| LysN ESI |
|
|---|
| TryLysC ESI |
|
|---|
| Try MALDI |
|
|---|
| ChTry MALDI |
|
|---|
| ArgC MALDI |
|
|---|
| LysN MALDI |
|
|---|
| TryLysC MALDI |
|
|---|
| Try LTQ |
|
|---|
| ChTry LTQ |
|
|---|
| ArgC LTQ |
|
|---|
| LysN LTQ |
|
|---|
| TryLysC LTQ |
|
|---|
| Try MSlow |
|
|---|
| ChTry MSlow |
|
|---|
| ArgC MSlow |
|
|---|
| LysN MSlow |
|
|---|
| TryLysC MSlow |
|
|---|
| Try MShigh |
|
|---|
| ChTry MShigh |
|
|---|
| ArgC MShigh |
|
|---|
| LysN MShigh |
|
|---|
| TryLysC MShigh |
|
|---|
General Statistics
Number of major isoforms |
Number of additional isoforms |
Number of all proteins |
Number of amino acids |
Min. Seq. Length |
Max. Seq. Length |
Avg. Seq. Length |
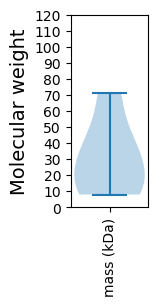
Avg. Mol. Weight |
|---|---|---|---|---|---|---|---|
0 |
1579 |
68 |
626 |
263.2 |
30.45 |
Amino acid frequency
Ala |
Cys |
Asp |
Glu |
Phe |
Gly |
His |
Ile |
Lys |
Leu |
|---|---|---|---|---|---|---|---|---|---|
4.433 ± 0.858 | 1.267 ± 0.45 |
5.13 ± 0.532 | 4.687 ± 0.462 |
6.966 ± 0.537 | 3.737 ± 0.565 |
1.583 ± 0.29 | 7.346 ± 0.694 |
7.6 ± 1.35 | 8.93 ± 0.232 |
Met |
Asn |
Gln |
Pro |
Arg |
Ser |
Thr |
Val |
Trp |
Tyr |
|---|---|---|---|---|---|---|---|---|---|
1.393 ± 0.27 | 9.88 ± 1.415 |
4.37 ± 0.756 | 5.13 ± 1.12 |
3.293 ± 0.747 | 8.233 ± 0.583 |
5.573 ± 0.732 | 4.053 ± 0.559 |
0.823 ± 0.163 | 5.573 ± 0.922 |
Most of the basic statistics you can see at this page can be downloaded from this CSV file
See this proteome in:

Proteome-pI is available under Creative Commons Attribution-NoDerivs license, for more details see here
| Reference: Kozlowski LP. Proteome-pI 2.0: Proteome Isoelectric Point Database Update. Nucleic Acids Res. 2021, doi: 10.1093/nar/gkab944 | Contact: Lukasz P. Kozlowski |