Thermosporothrix hazakensis
Taxonomy: cellular organisms; Bacteria; Terrabacteria group; Chloroflexi; Ktedonobacteria; Ktedonobacterales; Thermosporotrichaceae; Thermosporothrix
Average proteome isoelectric point is 6.58
Get precalculated fractions of proteins
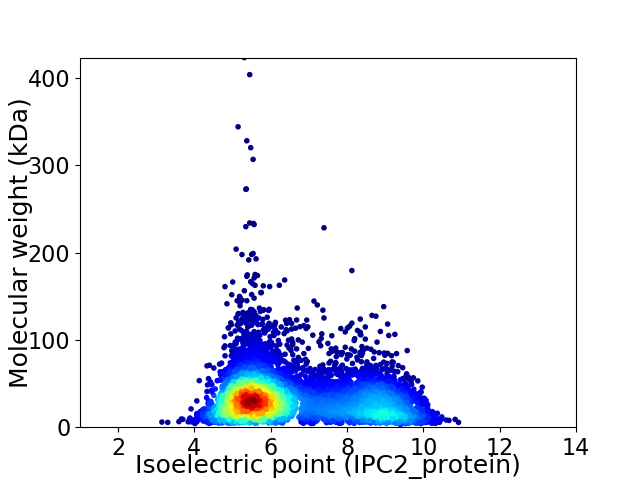
Virtual 2D-PAGE plot for 6382 proteins (isoelectric point calculated using IPC2_protein)
Get csv file with sequences according to given criteria:
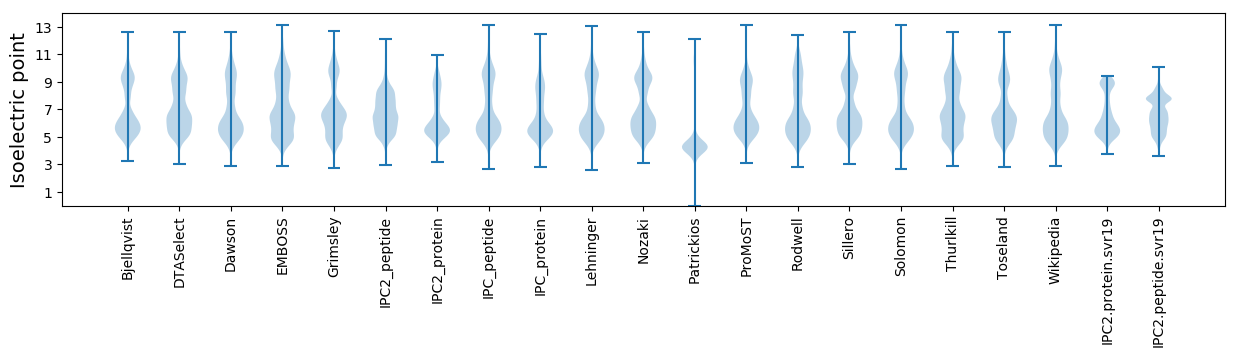
* You can choose from 21 different methods for calculating isoelectric point
Summary statistics related to proteome-wise predictions
Protein with the lowest isoelectric point:
>tr|A0A326U852|A0A326U852_9CHLR Uncharacterized protein OS=Thermosporothrix hazakensis OX=644383 GN=EI42_03543 PE=4 SV=1
MM1 pKa = 6.91EE2 pKa = 3.89QALIEE7 pKa = 4.64LEE9 pKa = 4.13HH10 pKa = 6.63DD11 pKa = 3.85TPVEE15 pKa = 4.19DD16 pKa = 6.21DD17 pKa = 4.01FEE19 pKa = 6.7LDD21 pKa = 3.31IRR23 pKa = 11.84VSAPSSDD30 pKa = 3.31IQPVALATANTCYY43 pKa = 10.3KK44 pKa = 10.62SCGTTCLSVNEE55 pKa = 4.38EE56 pKa = 4.27GG57 pKa = 4.75
MM1 pKa = 6.91EE2 pKa = 3.89QALIEE7 pKa = 4.64LEE9 pKa = 4.13HH10 pKa = 6.63DD11 pKa = 3.85TPVEE15 pKa = 4.19DD16 pKa = 6.21DD17 pKa = 4.01FEE19 pKa = 6.7LDD21 pKa = 3.31IRR23 pKa = 11.84VSAPSSDD30 pKa = 3.31IQPVALATANTCYY43 pKa = 10.3KK44 pKa = 10.62SCGTTCLSVNEE55 pKa = 4.38EE56 pKa = 4.27GG57 pKa = 4.75
Molecular weight: 6.16 kDa
Isoelectric point according different methods:
Protein with the highest isoelectric point:
>tr|A0A326TZZ1|A0A326TZZ1_9CHLR HD domain-containing protein OS=Thermosporothrix hazakensis OX=644383 GN=EI42_05132 PE=4 SV=1
MM1 pKa = 7.35KK2 pKa = 9.45RR3 pKa = 11.84TWQPKK8 pKa = 8.26RR9 pKa = 11.84IPRR12 pKa = 11.84KK13 pKa = 9.21RR14 pKa = 11.84EE15 pKa = 3.41HH16 pKa = 7.12GFMKK20 pKa = 10.49RR21 pKa = 11.84MATRR25 pKa = 11.84NGRR28 pKa = 11.84RR29 pKa = 11.84VLKK32 pKa = 10.49ARR34 pKa = 11.84RR35 pKa = 11.84AKK37 pKa = 10.39GRR39 pKa = 11.84WKK41 pKa = 9.86LTVV44 pKa = 2.99
MM1 pKa = 7.35KK2 pKa = 9.45RR3 pKa = 11.84TWQPKK8 pKa = 8.26RR9 pKa = 11.84IPRR12 pKa = 11.84KK13 pKa = 9.21RR14 pKa = 11.84EE15 pKa = 3.41HH16 pKa = 7.12GFMKK20 pKa = 10.49RR21 pKa = 11.84MATRR25 pKa = 11.84NGRR28 pKa = 11.84RR29 pKa = 11.84VLKK32 pKa = 10.49ARR34 pKa = 11.84RR35 pKa = 11.84AKK37 pKa = 10.39GRR39 pKa = 11.84WKK41 pKa = 9.86LTVV44 pKa = 2.99
Molecular weight: 5.47 kDa
Isoelectric point according different methods:
Peptides (in silico digests for buttom-up proteomics)
Below you can find in silico digests of the whole proteome with Trypsin, Chymotrypsin, Trypsin+LysC, LysN, ArgC proteases suitable for different mass spec machines.| Try ESI |
 |
|---|
| ChTry ESI |
|
|---|
| ArgC ESI |
|
|---|
| LysN ESI |
|
|---|
| TryLysC ESI |
|
|---|
| Try MALDI |
|
|---|
| ChTry MALDI |
|
|---|
| ArgC MALDI |
|
|---|
| LysN MALDI |
|
|---|
| TryLysC MALDI |
|
|---|
| Try LTQ |
|
|---|
| ChTry LTQ |
|
|---|
| ArgC LTQ |
|
|---|
| LysN LTQ |
|
|---|
| TryLysC LTQ |
|
|---|
| Try MSlow |
|
|---|
| ChTry MSlow |
|
|---|
| ArgC MSlow |
|
|---|
| LysN MSlow |
|
|---|
| TryLysC MSlow |
|
|---|
| Try MShigh |
|
|---|
| ChTry MShigh |
|
|---|
| ArgC MShigh |
|
|---|
| LysN MShigh |
|
|---|
| TryLysC MShigh |
|
|---|
General Statistics
Number of major isoforms |
Number of additional isoforms |
Number of all proteins |
Number of amino acids |
Min. Seq. Length |
Max. Seq. Length |
Avg. Seq. Length |
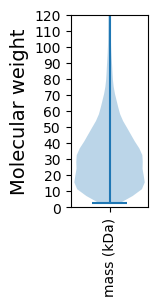
Avg. Mol. Weight |
|---|---|---|---|---|---|---|---|
0 |
2033648 |
22 |
3753 |
318.7 |
35.55 |
Amino acid frequency
Ala |
Cys |
Asp |
Glu |
Phe |
Gly |
His |
Ile |
Lys |
Leu |
|---|---|---|---|---|---|---|---|---|---|
9.314 ± 0.032 | 1.121 ± 0.011 |
4.479 ± 0.022 | 6.613 ± 0.033 |
3.715 ± 0.019 | 6.906 ± 0.027 |
2.533 ± 0.016 | 5.609 ± 0.022 |
3.58 ± 0.025 | 11.535 ± 0.041 |
Met |
Asn |
Gln |
Pro |
Arg |
Ser |
Thr |
Val |
Trp |
Tyr |
|---|---|---|---|---|---|---|---|---|---|
2.234 ± 0.013 | 2.838 ± 0.018 |
5.258 ± 0.024 | 5.159 ± 0.024 |
6.604 ± 0.031 | 5.667 ± 0.024 |
5.621 ± 0.021 | 6.677 ± 0.026 |
1.438 ± 0.012 | 3.098 ± 0.018 |
Most of the basic statistics you can see at this page can be downloaded from this CSV file
See this proteome in:

Proteome-pI is available under Creative Commons Attribution-NoDerivs license, for more details see here
| Reference: Kozlowski LP. Proteome-pI 2.0: Proteome Isoelectric Point Database Update. Nucleic Acids Res. 2021, doi: 10.1093/nar/gkab944 | Contact: Lukasz P. Kozlowski |