Chitinophaga costaii
Taxonomy: cellular organisms; Bacteria; FCB group; Bacteroidetes/Chlorobi group; Bacteroidetes; Chitinophagia; Chitinophagales; Chitinophagaceae; Chitinophaga
Average proteome isoelectric point is 6.86
Get precalculated fractions of proteins
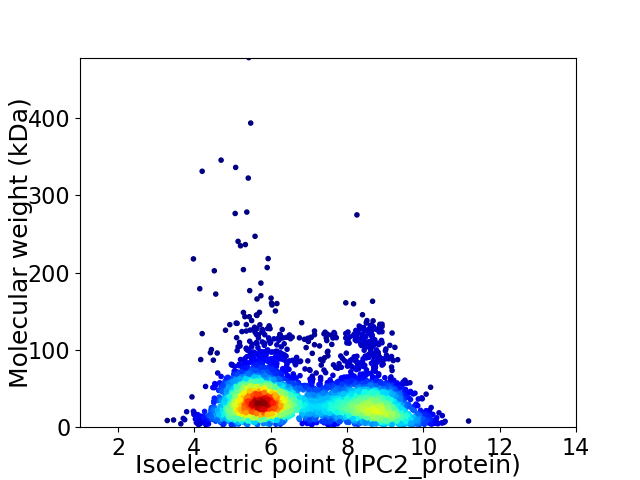
Virtual 2D-PAGE plot for 4204 proteins (isoelectric point calculated using IPC2_protein)
Get csv file with sequences according to given criteria:
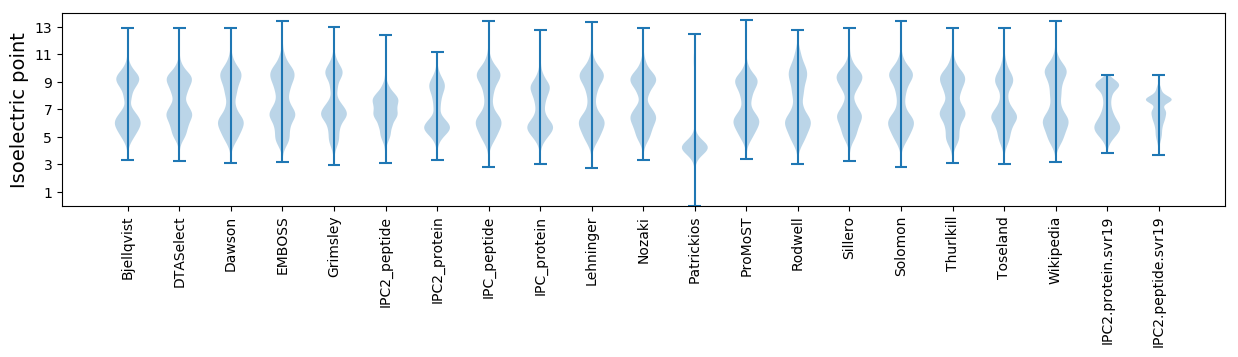
* You can choose from 21 different methods for calculating isoelectric point
Summary statistics related to proteome-wise predictions
Protein with the lowest isoelectric point:
>tr|A0A1C4ELG9|A0A1C4ELG9_9BACT HupE / UreJ protein OS=Chitinophaga costaii OX=1335309 GN=GA0116948_10912 PE=4 SV=1
MM1 pKa = 7.06TALEE5 pKa = 4.4VSTGAYY11 pKa = 7.48YY12 pKa = 10.54TDD14 pKa = 4.55IIDD17 pKa = 5.06KK18 pKa = 9.93EE19 pKa = 4.31DD20 pKa = 3.23HH21 pKa = 6.71RR22 pKa = 11.84LWQIQQIEE30 pKa = 4.28NGNSVFEE37 pKa = 4.25GTAYY41 pKa = 10.46SQWNGIEE48 pKa = 3.67WDD50 pKa = 3.43
MM1 pKa = 7.06TALEE5 pKa = 4.4VSTGAYY11 pKa = 7.48YY12 pKa = 10.54TDD14 pKa = 4.55IIDD17 pKa = 5.06KK18 pKa = 9.93EE19 pKa = 4.31DD20 pKa = 3.23HH21 pKa = 6.71RR22 pKa = 11.84LWQIQQIEE30 pKa = 4.28NGNSVFEE37 pKa = 4.25GTAYY41 pKa = 10.46SQWNGIEE48 pKa = 3.67WDD50 pKa = 3.43
Molecular weight: 5.82 kDa
Isoelectric point according different methods:
Protein with the highest isoelectric point:
>tr|A0A1C4F0A2|A0A1C4F0A2_9BACT AraC-type DNA-binding protein OS=Chitinophaga costaii OX=1335309 GN=GA0116948_110170 PE=4 SV=1
MM1 pKa = 7.55KK2 pKa = 10.49SILLVVLLAFTGAFAASAQTRR23 pKa = 11.84VVIRR27 pKa = 11.84PVPVAVRR34 pKa = 11.84PAVVVAPAVPVVVATPVSPVIVRR57 pKa = 11.84PAAVVVRR64 pKa = 11.84PAIRR68 pKa = 11.84RR69 pKa = 11.84RR70 pKa = 11.84VVVVRR75 pKa = 11.84RR76 pKa = 3.66
MM1 pKa = 7.55KK2 pKa = 10.49SILLVVLLAFTGAFAASAQTRR23 pKa = 11.84VVIRR27 pKa = 11.84PVPVAVRR34 pKa = 11.84PAVVVAPAVPVVVATPVSPVIVRR57 pKa = 11.84PAAVVVRR64 pKa = 11.84PAIRR68 pKa = 11.84RR69 pKa = 11.84RR70 pKa = 11.84VVVVRR75 pKa = 11.84RR76 pKa = 3.66
Molecular weight: 7.97 kDa
Isoelectric point according different methods:
Peptides (in silico digests for buttom-up proteomics)
Below you can find in silico digests of the whole proteome with Trypsin, Chymotrypsin, Trypsin+LysC, LysN, ArgC proteases suitable for different mass spec machines.| Try ESI |
 |
|---|
| ChTry ESI |
|
|---|
| ArgC ESI |
|
|---|
| LysN ESI |
|
|---|
| TryLysC ESI |
|
|---|
| Try MALDI |
|
|---|
| ChTry MALDI |
|
|---|
| ArgC MALDI |
|
|---|
| LysN MALDI |
|
|---|
| TryLysC MALDI |
|
|---|
| Try LTQ |
|
|---|
| ChTry LTQ |
|
|---|
| ArgC LTQ |
|
|---|
| LysN LTQ |
|
|---|
| TryLysC LTQ |
|
|---|
| Try MSlow |
|
|---|
| ChTry MSlow |
|
|---|
| ArgC MSlow |
|
|---|
| LysN MSlow |
|
|---|
| TryLysC MSlow |
|
|---|
| Try MShigh |
|
|---|
| ChTry MShigh |
|
|---|
| ArgC MShigh |
|
|---|
| LysN MShigh |
|
|---|
| TryLysC MShigh |
|
|---|
General Statistics
Number of major isoforms |
Number of additional isoforms |
Number of all proteins |
Number of amino acids |
Min. Seq. Length |
Max. Seq. Length |
Avg. Seq. Length |
Avg. Mol. Weight |
|---|---|---|---|---|---|---|---|
0 |
1471284 |
26 |
4319 |
350.0 |
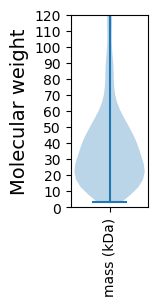
39.06 |
Amino acid frequency
Ala |
Cys |
Asp |
Glu |
Phe |
Gly |
His |
Ile |
Lys |
Leu |
|---|---|---|---|---|---|---|---|---|---|
8.581 ± 0.036 | 0.824 ± 0.014 |
5.199 ± 0.027 | 5.0 ± 0.049 |
4.563 ± 0.025 | 6.946 ± 0.033 |
2.317 ± 0.021 | 6.403 ± 0.032 |
5.688 ± 0.034 | 9.952 ± 0.043 |
Met |
Asn |
Gln |
Pro |
Arg |
Ser |
Thr |
Val |
Trp |
Tyr |
|---|---|---|---|---|---|---|---|---|---|
2.34 ± 0.02 | 4.994 ± 0.037 |
4.297 ± 0.023 | 4.482 ± 0.026 |
4.363 ± 0.027 | 5.941 ± 0.03 |
6.114 ± 0.056 | 6.569 ± 0.031 |
1.251 ± 0.014 | 4.178 ± 0.026 |
Most of the basic statistics you can see at this page can be downloaded from this CSV file
See this proteome in:

Proteome-pI is available under Creative Commons Attribution-NoDerivs license, for more details see here
| Reference: Kozlowski LP. Proteome-pI 2.0: Proteome Isoelectric Point Database Update. Nucleic Acids Res. 2021, doi: 10.1093/nar/gkab944 | Contact: Lukasz P. Kozlowski |