Capybara microvirus Cap3_SP_347
Taxonomy: Viruses; Monodnaviria; Sangervirae; Phixviricota; Malgrandaviricetes; Petitvirales; Microviridae; unclassified Microviridae
Average proteome isoelectric point is 6.23
Get precalculated fractions of proteins
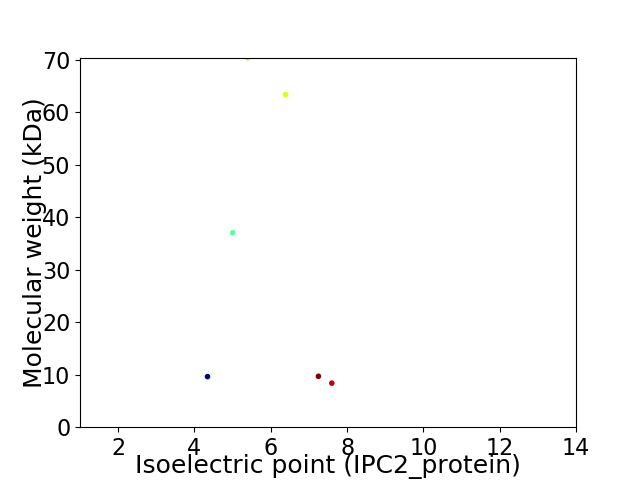
Virtual 2D-PAGE plot for 6 proteins (isoelectric point calculated using IPC2_protein)
Get csv file with sequences according to given criteria:
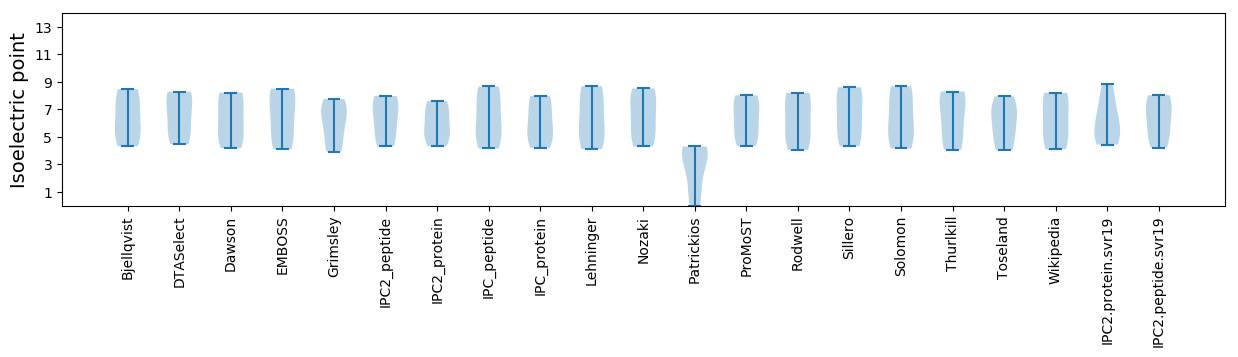
* You can choose from 21 different methods for calculating isoelectric point
Summary statistics related to proteome-wise predictions
Protein with the lowest isoelectric point:
>tr|A0A4P8W5P7|A0A4P8W5P7_9VIRU Minor capsid protein OS=Capybara microvirus Cap3_SP_347 OX=2585433 PE=4 SV=1
MM1 pKa = 7.65KK2 pKa = 10.13KK3 pKa = 9.81FQKK6 pKa = 10.29FPPDD10 pKa = 3.32GNVIIPSINSFEE22 pKa = 4.29ASFNADD28 pKa = 2.58GSVTFVPYY36 pKa = 10.21SAPSPFIASDD46 pKa = 3.3VDD48 pKa = 3.85IPSLLIAGITPQSSHH63 pKa = 6.01EE64 pKa = 4.15MEE66 pKa = 4.41LTPVDD71 pKa = 4.29SLSSLQQFEE80 pKa = 5.17HH81 pKa = 6.68EE82 pKa = 4.25FDD84 pKa = 3.54NFKK87 pKa = 11.09SS88 pKa = 3.53
MM1 pKa = 7.65KK2 pKa = 10.13KK3 pKa = 9.81FQKK6 pKa = 10.29FPPDD10 pKa = 3.32GNVIIPSINSFEE22 pKa = 4.29ASFNADD28 pKa = 2.58GSVTFVPYY36 pKa = 10.21SAPSPFIASDD46 pKa = 3.3VDD48 pKa = 3.85IPSLLIAGITPQSSHH63 pKa = 6.01EE64 pKa = 4.15MEE66 pKa = 4.41LTPVDD71 pKa = 4.29SLSSLQQFEE80 pKa = 5.17HH81 pKa = 6.68EE82 pKa = 4.25FDD84 pKa = 3.54NFKK87 pKa = 11.09SS88 pKa = 3.53
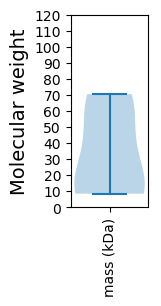
Molecular weight: 9.64 kDa
Isoelectric point according different methods:
Protein with the highest isoelectric point:
>tr|A0A4P8W4W7|A0A4P8W4W7_9VIRU Uncharacterized protein OS=Capybara microvirus Cap3_SP_347 OX=2585433 PE=4 SV=1
MM1 pKa = 7.61ANYY4 pKa = 9.37FKK6 pKa = 11.17LFLIYY11 pKa = 10.65LIYY14 pKa = 10.16FYY16 pKa = 10.59LYY18 pKa = 10.87SLFIYY23 pKa = 10.11SPHH26 pKa = 7.01RR27 pKa = 11.84AGGCLGGSLILDD39 pKa = 4.4FSHH42 pKa = 7.49LSIIPILFFYY52 pKa = 7.86YY53 pKa = 9.2FCYY56 pKa = 10.18FIFIFFYY63 pKa = 10.42FCIVKK68 pKa = 10.09II69 pKa = 4.0
MM1 pKa = 7.61ANYY4 pKa = 9.37FKK6 pKa = 11.17LFLIYY11 pKa = 10.65LIYY14 pKa = 10.16FYY16 pKa = 10.59LYY18 pKa = 10.87SLFIYY23 pKa = 10.11SPHH26 pKa = 7.01RR27 pKa = 11.84AGGCLGGSLILDD39 pKa = 4.4FSHH42 pKa = 7.49LSIIPILFFYY52 pKa = 7.86YY53 pKa = 9.2FCYY56 pKa = 10.18FIFIFFYY63 pKa = 10.42FCIVKK68 pKa = 10.09II69 pKa = 4.0
Molecular weight: 8.4 kDa
Isoelectric point according different methods:
Peptides (in silico digests for buttom-up proteomics)
Below you can find in silico digests of the whole proteome with Trypsin, Chymotrypsin, Trypsin+LysC, LysN, ArgC proteases suitable for different mass spec machines.| Try ESI |
 |
|---|
| ChTry ESI |
|
|---|
| ArgC ESI |
|
|---|
| LysN ESI |
|
|---|
| TryLysC ESI |
|
|---|
| Try MALDI |
|
|---|
| ChTry MALDI |
|
|---|
| ArgC MALDI |
|
|---|
| LysN MALDI |
|
|---|
| TryLysC MALDI |
|
|---|
| Try LTQ |
|
|---|
| ChTry LTQ |
|
|---|
| ArgC LTQ |
|
|---|
| LysN LTQ |
|
|---|
| TryLysC LTQ |
|
|---|
| Try MSlow |
|
|---|
| ChTry MSlow |
|
|---|
| ArgC MSlow |
|
|---|
| LysN MSlow |
|
|---|
| TryLysC MSlow |
|
|---|
| Try MShigh |
|
|---|
| ChTry MShigh |
|
|---|
| ArgC MShigh |
|
|---|
| LysN MShigh |
|
|---|
| TryLysC MShigh |
|
|---|
General Statistics
Number of major isoforms |
Number of additional isoforms |
Number of all proteins |
Number of amino acids |
Min. Seq. Length |
Max. Seq. Length |
Avg. Seq. Length |
Avg. Mol. Weight |
|---|---|---|---|---|---|---|---|
0 |
1724 |
69 |
610 |
287.3 |
33.1 |
Amino acid frequency
Ala |
Cys |
Asp |
Glu |
Phe |
Gly |
His |
Ile |
Lys |
Leu |
|---|---|---|---|---|---|---|---|---|---|
5.162 ± 1.798 | 1.856 ± 0.512 |
7.077 ± 0.814 | 4.118 ± 0.719 |
7.831 ± 1.741 | 4.756 ± 0.637 |
3.248 ± 1.024 | 5.51 ± 0.668 |
6.032 ± 0.715 | 9.687 ± 0.785 |
Met |
Asn |
Gln |
Pro |
Arg |
Ser |
Thr |
Val |
Trp |
Tyr |
|---|---|---|---|---|---|---|---|---|---|
2.03 ± 0.159 | 6.265 ± 0.688 |
3.712 ± 0.67 | 3.132 ± 0.692 |
3.48 ± 0.464 | 9.397 ± 1.167 |
4.06 ± 0.31 | 5.394 ± 0.704 |
0.58 ± 0.171 | 6.671 ± 1.446 |
Most of the basic statistics you can see at this page can be downloaded from this CSV file
See this proteome in:

Proteome-pI is available under Creative Commons Attribution-NoDerivs license, for more details see here
| Reference: Kozlowski LP. Proteome-pI 2.0: Proteome Isoelectric Point Database Update. Nucleic Acids Res. 2021, doi: 10.1093/nar/gkab944 | Contact: Lukasz P. Kozlowski |