Tomato yellow leaf curl Indonesia virus-[Lembang]
Taxonomy: Viruses; Monodnaviria; Shotokuvirae; Cressdnaviricota; Repensiviricetes; Geplafuvirales; Geminiviridae; Begomovirus; Tomato yellow leaf curl Indonesia virus
Average proteome isoelectric point is 8.01
Get precalculated fractions of proteins
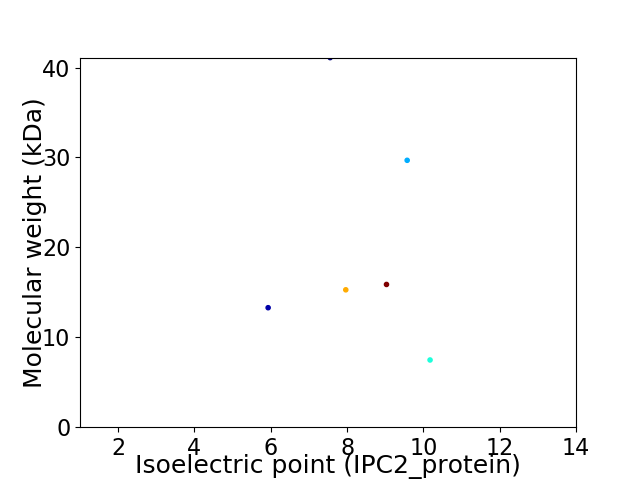
Virtual 2D-PAGE plot for 6 proteins (isoelectric point calculated using IPC2_protein)
Get csv file with sequences according to given criteria:
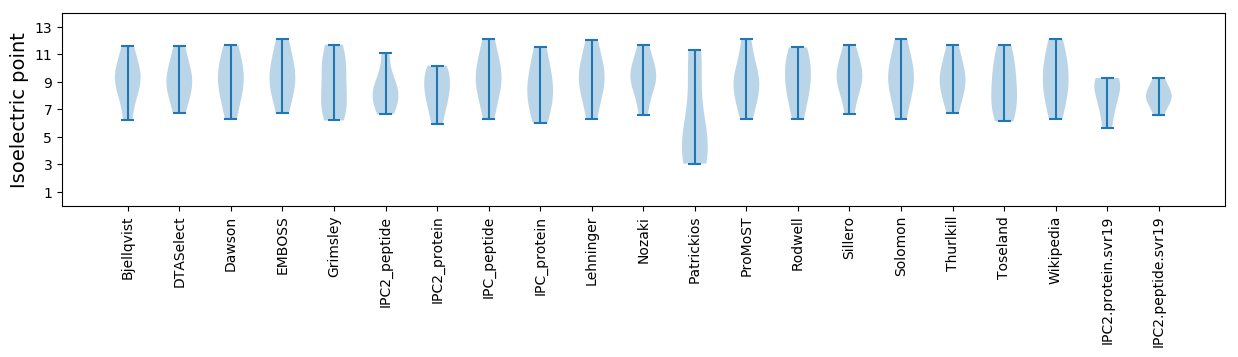
* You can choose from 21 different methods for calculating isoelectric point
Summary statistics related to proteome-wise predictions
Protein with the lowest isoelectric point:
>tr|Q9QD51|Q9QD51_9GEMI Protein V2 OS=Tomato yellow leaf curl Indonesia virus-[Lembang] OX=395349 GN=V2 PE=3 SV=1
MM1 pKa = 8.06WDD3 pKa = 3.35PLLNEE8 pKa = 4.99FPDD11 pKa = 3.86SVHH14 pKa = 6.81GFRR17 pKa = 11.84CMLAIKK23 pKa = 9.6YY24 pKa = 8.46LQGVEE29 pKa = 3.81ATYY32 pKa = 11.13APDD35 pKa = 3.34TVGYY39 pKa = 10.59DD40 pKa = 3.39LVRR43 pKa = 11.84DD44 pKa = 4.64LISVVRR50 pKa = 11.84ASNYY54 pKa = 10.28AEE56 pKa = 3.93ACRR59 pKa = 11.84RR60 pKa = 11.84YY61 pKa = 10.06SLFRR65 pKa = 11.84SRR67 pKa = 11.84IEE69 pKa = 4.04STPSSQLRR77 pKa = 11.84QPRR80 pKa = 11.84YY81 pKa = 9.33QPCCCTHH88 pKa = 6.58CPRR91 pKa = 11.84HH92 pKa = 5.91KK93 pKa = 10.64SKK95 pKa = 10.98EE96 pKa = 4.01VLDD99 pKa = 4.98FSAYY103 pKa = 10.04VPEE106 pKa = 4.69AQDD109 pKa = 4.72LPDD112 pKa = 3.76VPNSS116 pKa = 3.4
MM1 pKa = 8.06WDD3 pKa = 3.35PLLNEE8 pKa = 4.99FPDD11 pKa = 3.86SVHH14 pKa = 6.81GFRR17 pKa = 11.84CMLAIKK23 pKa = 9.6YY24 pKa = 8.46LQGVEE29 pKa = 3.81ATYY32 pKa = 11.13APDD35 pKa = 3.34TVGYY39 pKa = 10.59DD40 pKa = 3.39LVRR43 pKa = 11.84DD44 pKa = 4.64LISVVRR50 pKa = 11.84ASNYY54 pKa = 10.28AEE56 pKa = 3.93ACRR59 pKa = 11.84RR60 pKa = 11.84YY61 pKa = 10.06SLFRR65 pKa = 11.84SRR67 pKa = 11.84IEE69 pKa = 4.04STPSSQLRR77 pKa = 11.84QPRR80 pKa = 11.84YY81 pKa = 9.33QPCCCTHH88 pKa = 6.58CPRR91 pKa = 11.84HH92 pKa = 5.91KK93 pKa = 10.64SKK95 pKa = 10.98EE96 pKa = 4.01VLDD99 pKa = 4.98FSAYY103 pKa = 10.04VPEE106 pKa = 4.69AQDD109 pKa = 4.72LPDD112 pKa = 3.76VPNSS116 pKa = 3.4
Molecular weight: 13.29 kDa
Isoelectric point according different methods:
Protein with the highest isoelectric point:
>tr|Q9QD51|Q9QD51_9GEMI Protein V2 OS=Tomato yellow leaf curl Indonesia virus-[Lembang] OX=395349 GN=V2 PE=3 SV=1
MM1 pKa = 7.76LKK3 pKa = 10.25RR4 pKa = 11.84AGDD7 pKa = 3.5IAFSGPVSKK16 pKa = 10.59VRR18 pKa = 11.84RR19 pKa = 11.84RR20 pKa = 11.84LNYY23 pKa = 9.91DD24 pKa = 3.02SPGTSRR30 pKa = 11.84AAVLTALGINRR41 pKa = 11.84KK42 pKa = 9.5KK43 pKa = 10.54SWTSRR48 pKa = 11.84PMYY51 pKa = 9.55RR52 pKa = 11.84KK53 pKa = 8.49PRR55 pKa = 11.84IYY57 pKa = 10.79RR58 pKa = 11.84MYY60 pKa = 9.46RR61 pKa = 11.84TADD64 pKa = 3.31VPRR67 pKa = 11.84GCEE70 pKa = 4.41GPCKK74 pKa = 9.83IQSFEE79 pKa = 4.02SRR81 pKa = 11.84HH82 pKa = 6.29DD83 pKa = 3.27IAHH86 pKa = 6.41TGKK89 pKa = 10.37VMCVTDD95 pKa = 3.4VTRR98 pKa = 11.84GGGLTHH104 pKa = 6.43RR105 pKa = 11.84TGKK108 pKa = 10.01RR109 pKa = 11.84FCVKK113 pKa = 10.06SLYY116 pKa = 10.17ILGKK120 pKa = 9.29IWMDD124 pKa = 3.37EE125 pKa = 4.04NIKK128 pKa = 9.32TKK130 pKa = 10.61NHH132 pKa = 5.92TNTVMFYY139 pKa = 9.52VVRR142 pKa = 11.84DD143 pKa = 3.66RR144 pKa = 11.84RR145 pKa = 11.84PYY147 pKa = 9.21GTPQDD152 pKa = 3.82FGQVFNMFDD161 pKa = 3.99NEE163 pKa = 4.11PSTATVKK170 pKa = 10.85NDD172 pKa = 2.82LRR174 pKa = 11.84DD175 pKa = 3.42RR176 pKa = 11.84FQVLRR181 pKa = 11.84KK182 pKa = 8.36FTATVVGGQYY192 pKa = 10.67ACKK195 pKa = 9.94EE196 pKa = 3.83QTLVRR201 pKa = 11.84KK202 pKa = 9.44FMRR205 pKa = 11.84LNNYY209 pKa = 7.92VVYY212 pKa = 10.63NHH214 pKa = 6.28QEE216 pKa = 3.67TAKK219 pKa = 10.86YY220 pKa = 9.93EE221 pKa = 4.15NHH223 pKa = 6.41TEE225 pKa = 3.99NALLLYY231 pKa = 8.57MASTHH236 pKa = 6.41ASNPVYY242 pKa = 9.86ATLKK246 pKa = 9.47IRR248 pKa = 11.84IYY250 pKa = 10.59FYY252 pKa = 11.38DD253 pKa = 4.2SITNN257 pKa = 3.6
MM1 pKa = 7.76LKK3 pKa = 10.25RR4 pKa = 11.84AGDD7 pKa = 3.5IAFSGPVSKK16 pKa = 10.59VRR18 pKa = 11.84RR19 pKa = 11.84RR20 pKa = 11.84LNYY23 pKa = 9.91DD24 pKa = 3.02SPGTSRR30 pKa = 11.84AAVLTALGINRR41 pKa = 11.84KK42 pKa = 9.5KK43 pKa = 10.54SWTSRR48 pKa = 11.84PMYY51 pKa = 9.55RR52 pKa = 11.84KK53 pKa = 8.49PRR55 pKa = 11.84IYY57 pKa = 10.79RR58 pKa = 11.84MYY60 pKa = 9.46RR61 pKa = 11.84TADD64 pKa = 3.31VPRR67 pKa = 11.84GCEE70 pKa = 4.41GPCKK74 pKa = 9.83IQSFEE79 pKa = 4.02SRR81 pKa = 11.84HH82 pKa = 6.29DD83 pKa = 3.27IAHH86 pKa = 6.41TGKK89 pKa = 10.37VMCVTDD95 pKa = 3.4VTRR98 pKa = 11.84GGGLTHH104 pKa = 6.43RR105 pKa = 11.84TGKK108 pKa = 10.01RR109 pKa = 11.84FCVKK113 pKa = 10.06SLYY116 pKa = 10.17ILGKK120 pKa = 9.29IWMDD124 pKa = 3.37EE125 pKa = 4.04NIKK128 pKa = 9.32TKK130 pKa = 10.61NHH132 pKa = 5.92TNTVMFYY139 pKa = 9.52VVRR142 pKa = 11.84DD143 pKa = 3.66RR144 pKa = 11.84RR145 pKa = 11.84PYY147 pKa = 9.21GTPQDD152 pKa = 3.82FGQVFNMFDD161 pKa = 3.99NEE163 pKa = 4.11PSTATVKK170 pKa = 10.85NDD172 pKa = 2.82LRR174 pKa = 11.84DD175 pKa = 3.42RR176 pKa = 11.84FQVLRR181 pKa = 11.84KK182 pKa = 8.36FTATVVGGQYY192 pKa = 10.67ACKK195 pKa = 9.94EE196 pKa = 3.83QTLVRR201 pKa = 11.84KK202 pKa = 9.44FMRR205 pKa = 11.84LNNYY209 pKa = 7.92VVYY212 pKa = 10.63NHH214 pKa = 6.28QEE216 pKa = 3.67TAKK219 pKa = 10.86YY220 pKa = 9.93EE221 pKa = 4.15NHH223 pKa = 6.41TEE225 pKa = 3.99NALLLYY231 pKa = 8.57MASTHH236 pKa = 6.41ASNPVYY242 pKa = 9.86ATLKK246 pKa = 9.47IRR248 pKa = 11.84IYY250 pKa = 10.59FYY252 pKa = 11.38DD253 pKa = 4.2SITNN257 pKa = 3.6
Molecular weight: 29.68 kDa
Isoelectric point according different methods:
Peptides (in silico digests for buttom-up proteomics)
Below you can find in silico digests of the whole proteome with Trypsin, Chymotrypsin, Trypsin+LysC, LysN, ArgC proteases suitable for different mass spec machines.| Try ESI |
 |
|---|
| ChTry ESI |
|
|---|
| ArgC ESI |
|
|---|
| LysN ESI |
|
|---|
| TryLysC ESI |
|
|---|
| Try MALDI |
|
|---|
| ChTry MALDI |
|
|---|
| ArgC MALDI |
|
|---|
| LysN MALDI |
|
|---|
| TryLysC MALDI |
|
|---|
| Try LTQ |
|
|---|
| ChTry LTQ |
|
|---|
| ArgC LTQ |
|
|---|
| LysN LTQ |
|
|---|
| TryLysC LTQ |
|
|---|
| Try MSlow |
|
|---|
| ChTry MSlow |
|
|---|
| ArgC MSlow |
|
|---|
| LysN MSlow |
|
|---|
| TryLysC MSlow |
|
|---|
| Try MShigh |
|
|---|
| ChTry MShigh |
|
|---|
| ArgC MShigh |
|
|---|
| LysN MShigh |
|
|---|
| TryLysC MShigh |
|
|---|
General Statistics
Number of major isoforms |
Number of additional isoforms |
Number of all proteins |
Number of amino acids |
Min. Seq. Length |
Max. Seq. Length |
Avg. Seq. Length |
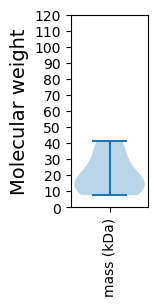
Avg. Mol. Weight |
|---|---|---|---|---|---|---|---|
0 |
1069 |
65 |
362 |
178.2 |
20.45 |
Amino acid frequency
Ala |
Cys |
Asp |
Glu |
Phe |
Gly |
His |
Ile |
Lys |
Leu |
|---|---|---|---|---|---|---|---|---|---|
5.332 ± 0.593 | 2.245 ± 0.468 |
5.051 ± 0.448 | 4.022 ± 0.675 |
4.397 ± 0.524 | 4.864 ± 0.499 |
3.742 ± 0.449 | 5.426 ± 0.975 |
6.08 ± 0.749 | 7.858 ± 0.729 |
Met |
Asn |
Gln |
Pro |
Arg |
Ser |
Thr |
Val |
Trp |
Tyr |
|---|---|---|---|---|---|---|---|---|---|
2.152 ± 0.503 | 6.268 ± 0.638 |
5.987 ± 0.733 | 4.303 ± 0.652 |
7.016 ± 1.198 | 7.858 ± 1.403 |
5.893 ± 0.845 | 5.893 ± 1.126 |
1.31 ± 0.179 | 4.303 ± 0.623 |
Most of the basic statistics you can see at this page can be downloaded from this CSV file
See this proteome in:

Proteome-pI is available under Creative Commons Attribution-NoDerivs license, for more details see here
| Reference: Kozlowski LP. Proteome-pI 2.0: Proteome Isoelectric Point Database Update. Nucleic Acids Res. 2021, doi: 10.1093/nar/gkab944 | Contact: Lukasz P. Kozlowski |